CAKE, the native token of the PancakeSwap protocol, was originally built on BNB Smart Chain [BSC] and launched in September 2020. However, it has transformed into a multi-chain protocol available across Ethereum [ETH], Arbitrum One [ARB], Linea, and Base since. PancakeSwap was founded by a pseudonymous group that remains undisclosed to preserve the decentralized nature of DeFi. The most notable members of this group were Chef Mochi, who was the Head, Chef Hops, and Chef Cos.

PancakeSwap’s primary importance to the crypto ecosystem remains a decentralized exchange (DEX) where traders can swap their tokens without relying on central authority. It supports advanced trading of options, prediction markets, and Web3 gaming. PancakeSwap is used for yield farming, where users can earn CAKE by depositing the token into liquidity pools (LP) and also for staking.ย 

For investors in PancakeSwap, Binance’s capital venture Binance Labs remains key. However, there are other institutional backers, which include JellyC, YZi Labs, Iconium Blockchain Ventures, and Buks Capital.ย 

According to CoinMarketCap, the maximum supply of CAKE stands at 400 million. At press time, the total supply available was 337.53 million, but the circulating supply was 325.14 million. The difference in the total supply and circulating supply is due to CAKE’s burn mechanism, which is deflationary. The protocol uses some of its revenue to permanently burn the tokens from circulation. In June 2026, the deflationary rate stood at 0.12% – Equivalent to 339K CAKE each time. Its market cap was above $400 million, with a Fully Diluted Value (FDV) of almost $500 million.ย 

There are a couple of developments that make PancakeSwap a notable protocol in the crypto ecosystem. In 2023, upgrades such as the V3 Swap Protocol Integration for liquidity and smart pool routing, as well as Ultrasound CAKE Tokenomics, which reduced the maximum cap by 40% through a community proposal, were introduced.

Between 2024 and 2025, the protocol saw Multi-Chain Expansion, making it more interoperable across 10 distinct blockchains. Also, in 2025, Tokenomics 3.0 transitioned PancakeSwap into a more transparent buyback and burn after sunsetting the veCAKE governance system.

In May 2026, the protocol added off-AMM liquidity for major pairs on Ethereum to provide institutional-grade quotes and tighter spreads.ย 

The team is still ongoing with other upgrades this year, especially with the crypto ecosystem expanding via tokenization of traditional assets like equities and commodities, among others. For instance, Agentic Trading, RWA & Tokenized Stock Rails, Pro-Grade Perps, and Deeper Market Maker Network are all listed in the PancakeSwap roadmap.ย 

According to DefiLlama, the protocol still commands about $2 billion in Total Value Locked (TVL) from a peak value of $12 billion during the 2021 altcoin season. Back then, CAKE had surged to its peak market cap. Security concerns in DeFi protocols potentially caused the drop, and PancakeSwap was not an exception.ย 

In 2021, a massive flash loan attack on yield aggregator PancakeBunny exploited about $45 million after manipulating liquidity pool ratios. PancakeSwap also lost $700K in a logic error in its lottery smart contract that year.

In 2025, attackers pre-purchased unlisted tokens, manipulating the CAKE trading pairs of the memecoin platform Four.meme. Also, the same year, its Chinese X (formerly Twitter) was hacked.

In 2026, controversy arose after Curve Finance accused PancakeSwap of copying its StableSwap code without proper licensing to power PancakeSwap Infinity.

On the institutional side, investors can trade on-chain tokenized ETFs on the platform through partnerships on BNB Chain. However, there remains no standalone crypto ETF for CAKE.

VIEW MORE

Overview

Market Cap
$462.23M
+2.2%
Volume (24H)
$26.76M
Volume (7D)
$174.56M
+3.7%
Max Supply
400,000,000 CAKE
Circulating Supply
322,753,473 CAKE
All-Time High
$43.96
-96.7%
All-Time Low
$0.194441
+636.2%
(above ATL)

Prediction Analysis

Current Price
$1.43
Sentiment
Neutral
50-Day SMA
$1.36
Price Prediction
$0.70
-50.80%
Fear & Greed Index
200-Day SMA
$1.50
Green Days
12 / last 30 (41.4%)
Volatility
2.12%
Moderate
14-Day RSI
62.64
Neutral

Profit Calculator

Select asset
%
%
Total Profit
$0
(0%)
Total Exit Amount
$0
Total Investment Fee
$0
Total Exit Fee
$0

PancakeSwap Price Prediction

Current Price
$1.43
2031
$0.04
2036
$0.00
2041
$0.00
2046
$0.00

Results are based solely on your predicted price change. They are not indicators of future performance and do not take into account different performance scenarios, historical data, or the effect of fees or other charges.

VIEW MORE

Short-Term PancakeSwap Price Targets

Date Prediction Change
Jul 16, 2026 $1.36 -5.00%
Jul 17, 2026 $1.29 -9.75%
Jul 18, 2026 $1.23 -14.26%
Jul 19, 2026 $1.16 -18.55%
Jul 20, 2026 $1.11 -22.62%
Jul 21, 2026 $1.05 -26.49%
Jul 22, 2026 $1.00 -30.17%

CAKE, at the time of writing, was trading at around $1.23, with its short-term targets well within the consolidation levels and just above them. If the altcoin can stay above the support level at $1, a bounce towards the $4.73 - $5 zone may be viable. Only breaking above this resistance level around $5 would suggest a potential rally to around $9.70โ€“$10. However, if bears manage to push CAKE below $1, the altcoin may dip to the launch price - The long-term support.

VIEW MORE

Monthly PancakeSwap Price Prediction

Jun 30, 2026
$1.31
Jul 14, 2026
$1.43
Highest in Jul
$1.47
Lowest in Jul
$1.31
Overall Performance
Rising

Long-Term PancakeSwap Price Prediction

Month Price AVG Price Max Price Change
Jul $1.15 $1.29 $1.29 -19.58%
Aug $0.92 $1.04 $1.04 -35.66%
Sep $0.74 $0.83 $0.83 -48.25%
Oct $0.60 $0.67 $0.67 -58.04%
Nov $0.48 $0.54 $0.54 -66.43%
Dec $0.39 $0.43 $0.43 -72.73%
In June 2026, the long-term targets were in line with the near-term targets being hit. If CAKE can break above the triangle pattern consolidation and stay above $5, it may achieve targets of $22, $40, or higher. This scenario does not rule out the possibility of dipping below the launch price of $1.3772 up to around its all-time lows of $0.0002318 though.
VIEW MORE

Historical Price Performance

Year Highest Price Lowest Price
2026 (to date) $2 $1
2025 $4 $1
2024 $5 $1
2023 $5 $1
2022 $12 $3
2021 $42 $0
2020 $1 $0

In June 2026, CAKE was trading more than 97% below its peak value. In the past, its major price drawdowns have been influenced by initial inflationary tokenomics, protocol exploits, social media hacks, and broader market crashes like that of 10 October. Back then, CAKE's price dropped from $5 to $1.54, returning to the long-term accumulation pattern. On the other hand, proposals like revising the max cap helped reduce the rate at which the altcoin's price fell. Additionally, trends in the BNB ecosystem have caused CAKE to surge too, with the opposite being true as well.

VIEW MORE

Technical Analysis

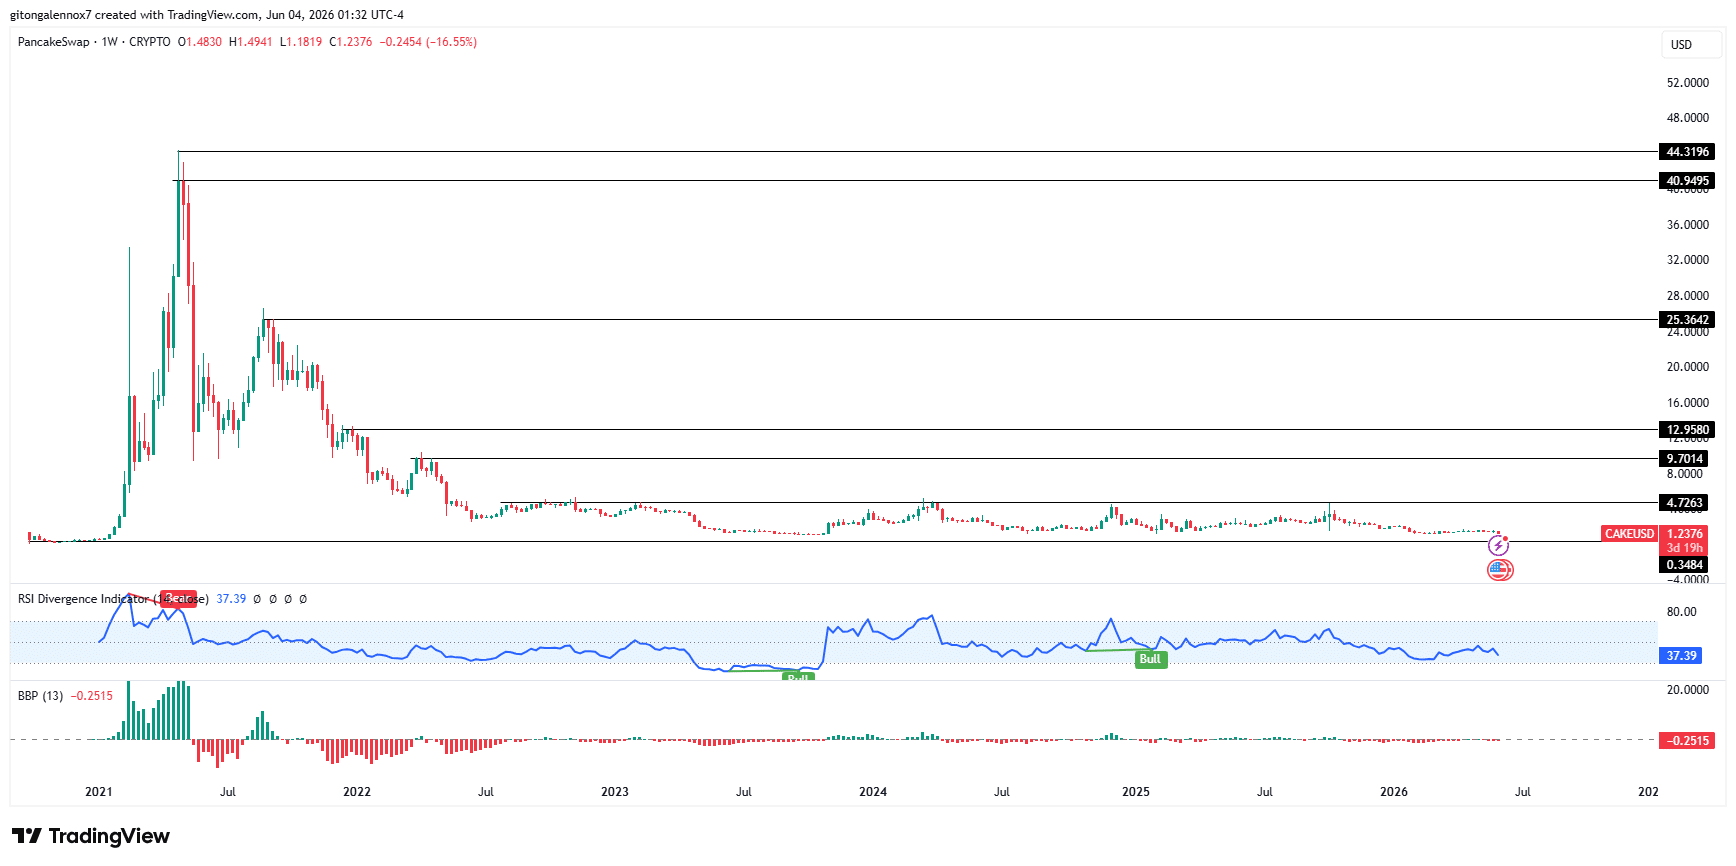
On the charts, CAKE appeared bullish in the short term because traders believed the token might be undervalued. The altcoin was trading at the launch price level around $1.20 on the weekly chart. It seemed to have consolidated between $0.3484 and $4.7263 since mid-2022, an indication of long-term accumulation reflected on a shorter timeframe.ย 

In 2021, CAKE peaked at over $44 but dropped to around $12 three months later. The price bounced back to around $25 and took a steep nosedive to its press time levels. The RSI divergence has been bullish since the third quarter of 2023 – A sign that bulls have been quietly buying in this sideways market. However, there appeared to be no strength either from buyers or sellers as per the Bulls Bear Power indicator.ย 

Source: CAKE/USDT, TradingView

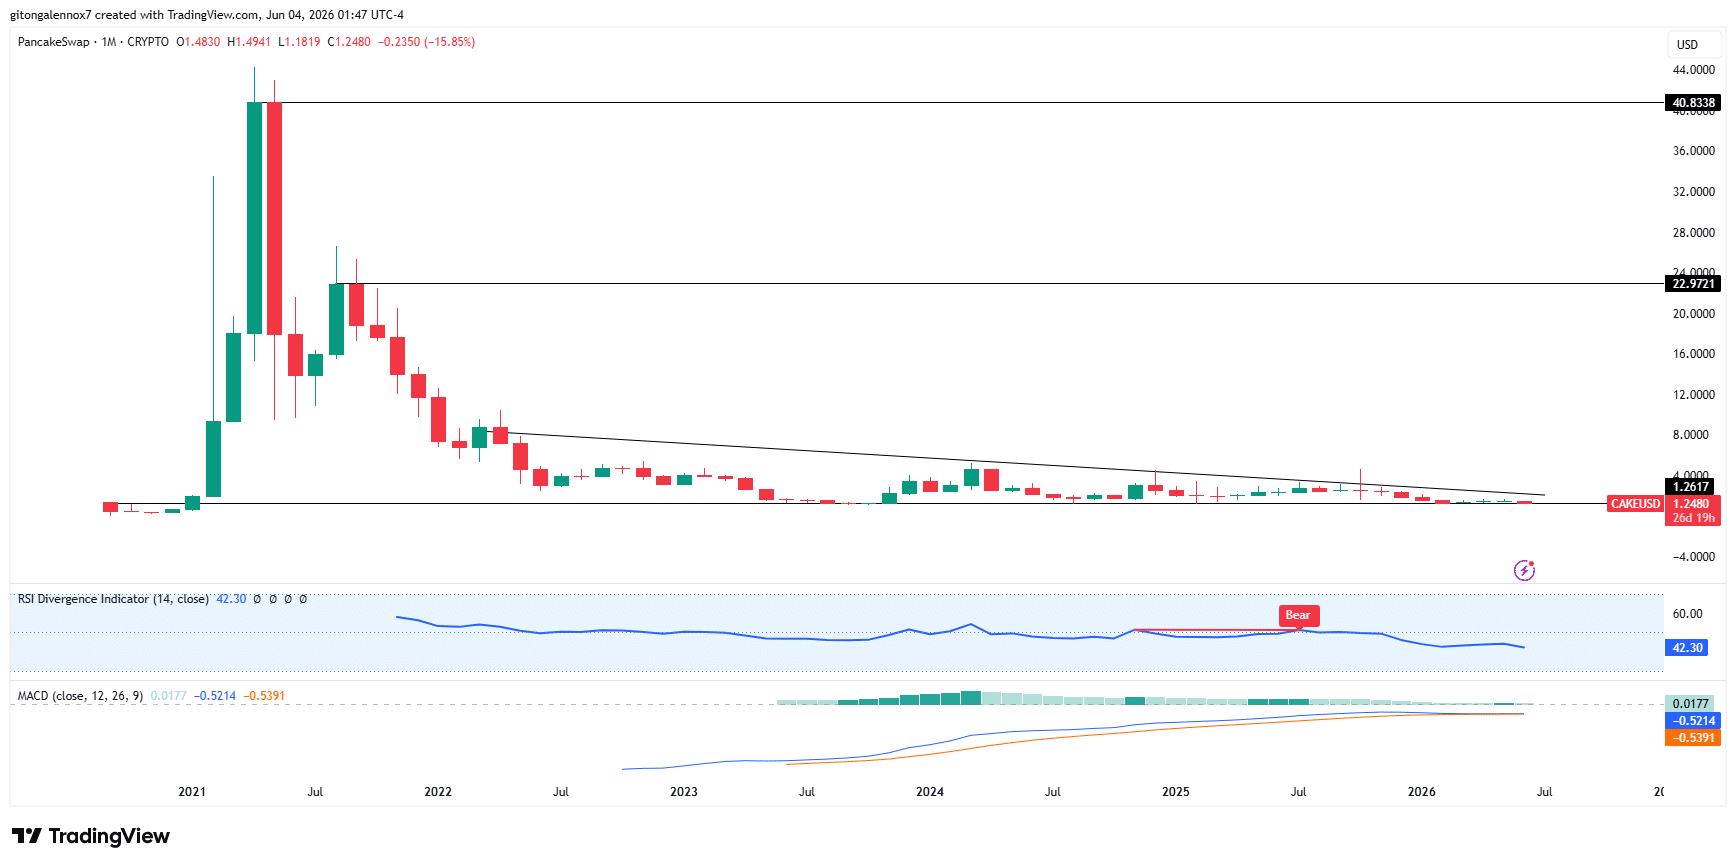
On the bigger scale, it seemed that CAKE might be confined in a triangle pattern. The movement was approaching a breakout zone at the apex of the pattern. However, the RSI Divergence on the monthly chart was giving a bearish signal. This suggested that bears have controlled the price since 2022, hence why CAKE failed to reclaim its peak levels.ย 

Source: CAKE/USDT, TradingView

On the contrary, the MACD for the long-term outlook was green, but the size of the bars was minimal. This indicator confirmed the lack of strength from bulls even though they have been buying CAKE.

Guides

How to Read PancakeSwap Charts and Predict Price Movements?

Most traders use candlestick charts, as they provide more information than a simple line chart. Traders can view candlesticks that represent the price action of PancakeSwap with different granularity โ€“ for example, you could choose a 5-minute candlestick chart for extremely short-term price action or choose a weekly candlestick chart to identify long-term trends. 1-hour, 4-hour, and 1-day candlestick charts are among the most popular.

Letโ€™s use a 1-hour candlestick chart as an example of how this type of price chart gives us information about opening and closing prices. The chart is divided into โ€œcandlesโ€ that give us information about PancakeSwapโ€™s price action in 1-hour chunks. Each candlestick will display the assetโ€™s opening price, closing price, as well as the highest and lowest prices reached within that period.

PancakeSwap Price Prediction Indicators

Moving averages are among the most popular PancakeSwap price prediction tools. As the name suggests, a moving average provides the average closing price over a selected time frame, which is divided into a number of periods of the same length. For example, a 12-day simple moving average is calculated by summing the closing prices over the last 12 days and dividing the result by 12.

In addition to the simple moving average (SMA), traders also use another type of moving average called the exponential moving average (EMA). The EMA gives more weight to recent prices, and therefore reacts more quickly to changes in market conditions.

What Affects the Price of PancakeSwap?

Just like with any other asset, the price action of PancakeSwap is driven by supply and demand. These dynamics can be influenced by fundamental events such as block reward halvings, hard forks, or new protocol updates. Regulations, adoption by companies and governments, cryptocurrency exchange hacks, and other real-world events can also affect market sentiment.

Technical indicators such as moving averages, RSI, and trading volume are also used by traders to anticipate price movements and identify potential trend reversals.

FAQs on PancakeSwap Price Predictions

As of today, PancakeSwap (CAKE) is trading at $1.43. The current market sentiment is Neutral, with RSI at 62.64 (Neutral) and volatility classified as Moderate.
Based on our technical analysis and projected annual growth rate, PancakeSwap could reach $0.70356 by 2027. This estimate assumes continued market momentum and adoption trends.
According to our technical analysis indicators, the PancakeSwap price prediction is forecasted to reach $0.041225 within the next five years (by 2031). Over the last 30 days, PancakeSwap recorded green days 41% of the time.
Based on multiple technical indicators, the current outlook for PancakeSwap in 2026 is Neutral. RSI currently sits at 62.64, which indicates Neutral momentum. However, investors should evaluate both technical signals and fundamental developments before making any investment decisions.
Long-term forecasts indicate that PancakeSwap may continue to grow over the next decade if adoption, technology development, and global crypto demand continue to expand.
While PancakeSwap's future value depends on various factors, technical indicators suggest it could experience both bullish and bearish cycles over time. Long-term investors typically monitor RSI levels, moving averages, and broader market sentiment when evaluating CAKE's future trajectory.
Disclaimer

AMBCrypto's content is meant to be informational in nature and should not be interpreted as investment advice. Trading, buying or selling cryptocurrencies should be considered a high-risk investment and every reader is advised to do their own research before making any decisions.