A closer look at Cardano’s daily, weekly charts reveals this

Gains seen in market leaders Bitcoin and Ethereum have propelled certain altcoins to new heights. Recently, the likes of Shiba Inu, Polkadot, MATIC and now Stellar have seen strong rallies amidst a risk-on broader market.
While these coins garnered much interest from the crypto community, Cardano failed to deliver on bullish expectations. In fact, the world’s third largest digital asset was still struggling to overcome its short-term daily EMA’s and was kept below a key resistance zone.
However, a closer inspection at the daily and weekly charts indicated that ADA was still within a bullish-bias even after considering the recent price movement. This article sheds some more light on why ADA could explode to the upside after overcoming some near-term tailwinds.
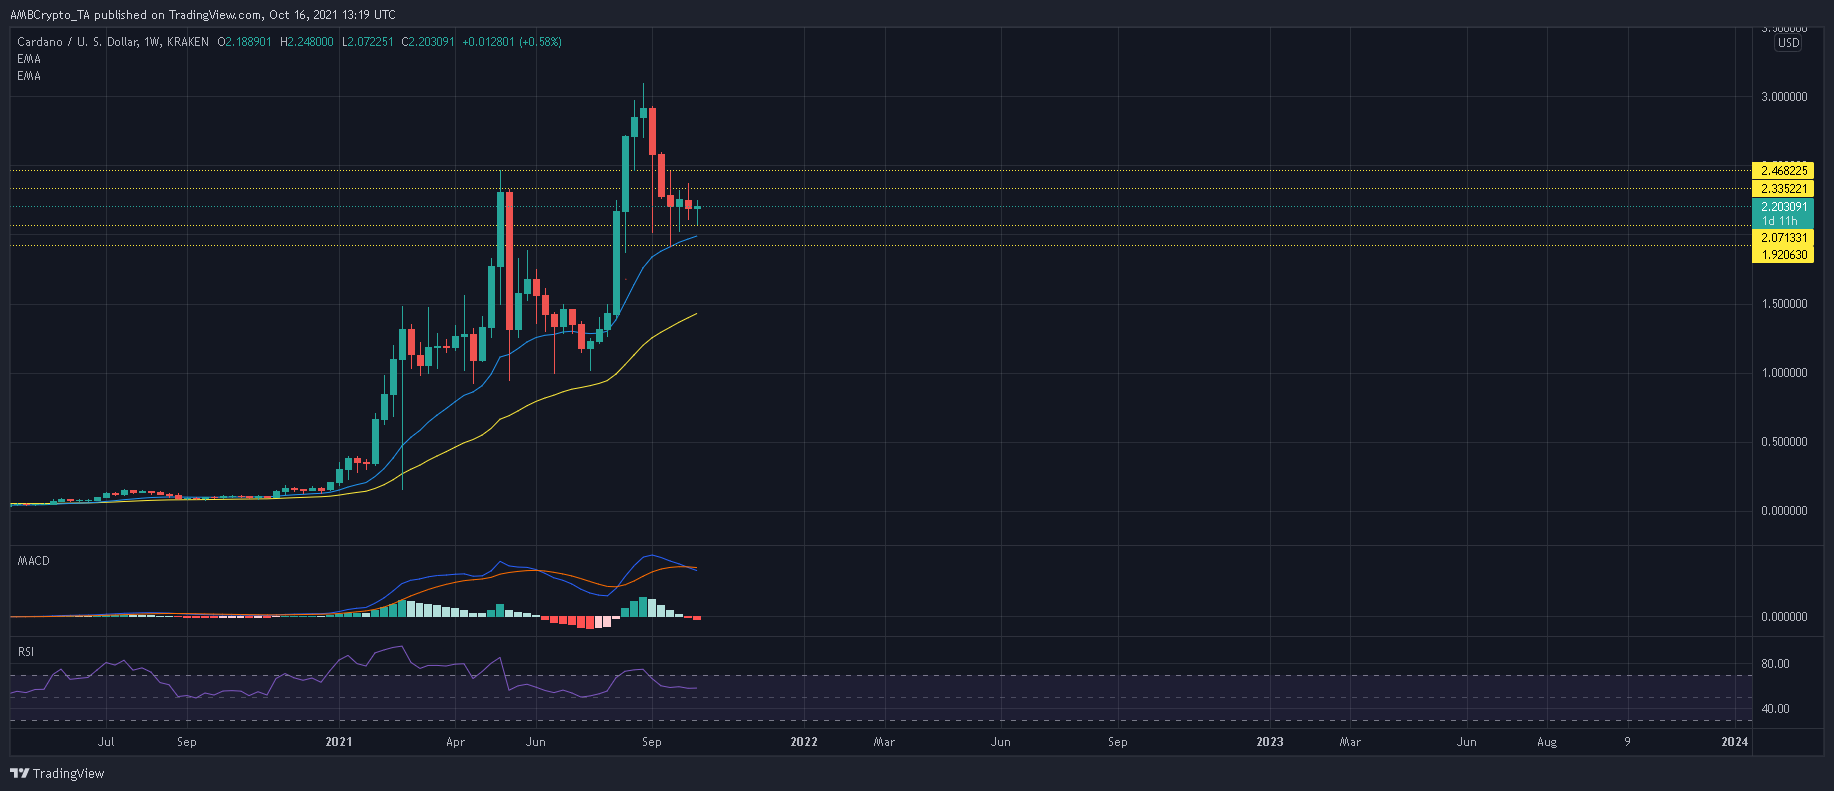
Cardano Weekly Chart
A fourth consecutive short bodied candlestick was in development on ADA’s weekly chart. This development highlighted a period indecision in the market following ADA’s decline from record levels. As market participants rubbed elbows above the $2-mark, it was worth mentioning that ADA traded above its weekly 20 and 50 EMA’s.
This reading suggested that ADA was still an attractive investment for new bullish traders despite its consolidatory nature. Moreover, an RSI reading of 58 made abated any fears of sharp decline. Having said that, the coming week could generate some selling pressure on the back of MACD’s bearish crossover.
Cardano Daily Chart
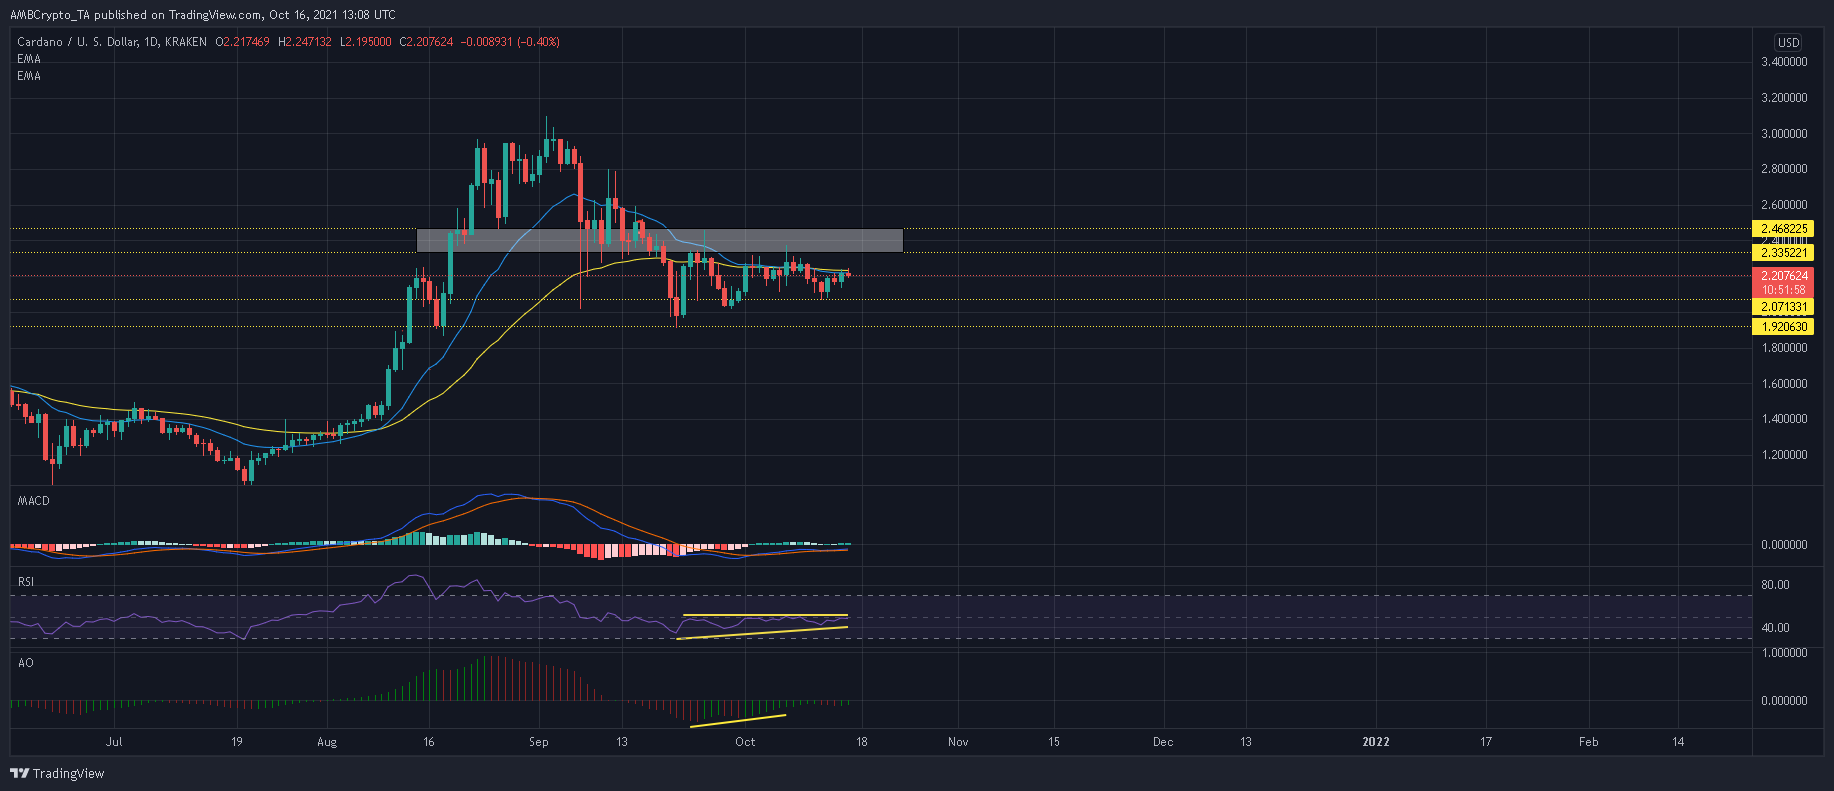
Now on the daily timeframe, the situation was slightly different. The double combo of ADA’s 20-EMA (light blue) and 50-SMA (yellow) was proving to be a persistent bottleneck. These MA’s have restricted ADA’s price progression since flipping bearish in late-September.
As bulls muster the strength for a decisive close above these MA’s, expect ADA’s to retest its near-term support at $2.07. A daily close above $2.25 would see ADA challenge a resistance barrier of $2.35-$2.46. A successful breakout from the upper boundary of this zone could spur a comeback to $3, provided bulls are able to negotiate past selling pressure at $2.80.
If bulls do take a hit below $2.07, some additional bleeding can be expected due to the lack of strong support levels. Bulls would hope to reignite momentum between $1.83-$1.88.
Reasoning
Now based on the RSI has formed higher lows while maintaining highs around 50. This ascending triangle presented massive upside for ADA once bulls are able to move above the half-line with conviction. While the MACD did not present any clear bull signals, the formation of higher peaks should not be overlooked.
Similarly, a bullish twin peak setup on the Awesome Oscillator suggested that bulls were making progress despite a rangebound market.
Conclusion
ADA needed to wait longer before catching up to the percentage gains seen in BTC and ETH. Once ADA closes above its short-term EMA’s and smashes past the $2.35-$2.46 range, expect bulls to be in command. The weekly timeframe combined with the daily indicators confirmed that ADA was still within a bullish outlook.


