A possible bounceback on the cards for MATIC, but is recovery still a distant dream

Polygon has been on a downtrend from the $2.8 highs it achieved in late December. Over the past week, it has shed around 18% in value and could be headed lower as well. However, on lower timeframes, Polygon appeared to offer some trading opportunities, which hinged on Polygon failing to break the trendline resistance once more.
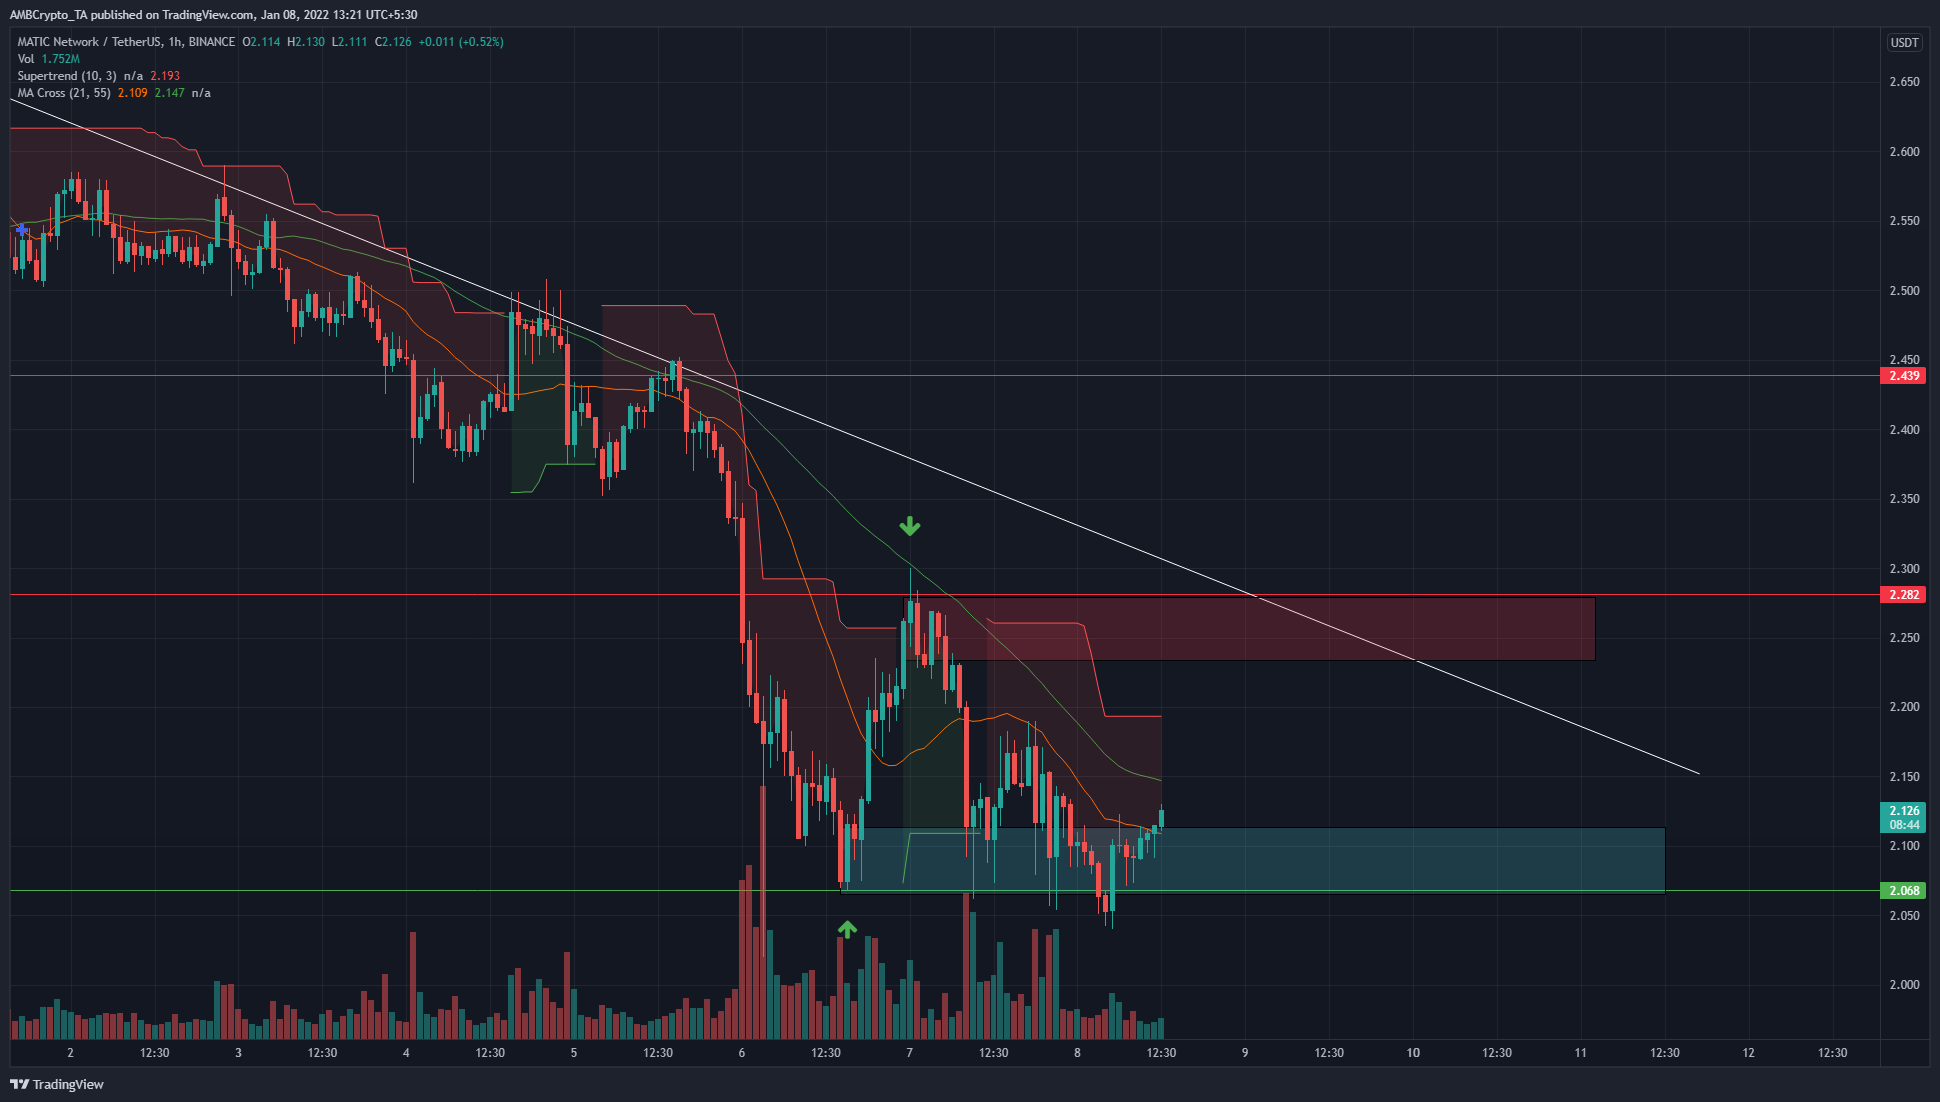
On the hourly chart, bullish and bearish order blocks (green arrows) were identified (cyan and red box). These were areas where the price went into, and subsequently experienced a sharp, impulsive move in the opposite direction.
These areas also have confluence with significant levels of support and resistance, at $2.06 and $2.28.
The descending trendline resistance (white) stretched back to the $2.8 highs of nearly ten days ago and has rejected the price multiple times since then. This made the trendline significant on the charts.
The most recent dip did fall slightly below $2.06 but has still managed to bounce well, although trading volume was slightly lower than previously. Hence, a long position can be entered, targeting the $2.26 area.
If the price does manage to climb to that area, there is confluence from both the $2.28 resistance as well as the trendline resistance, making it an area to look for short position entries.
Rationale

The OBV has been in steady decline since the $2.8 highs but appeared to have found a bottom recently, even though this could just be temporary. The hourly chart’s RSI also appeared to climb past neutral 50 to denote bullish momentum was slowly on the rise.
Taken together, this suggested that MATIC could see a bounce soon.
A cautionary note was suggested by both the Supertrend, and the 21 and 55-period moving averages. The Supertrend continued to show a sell signal, while the 21-SMA (orange) was moving below the 55-SMA (green) which showed bearish momentum was present.
Conclusion
The indicators suggested that, although the trend was bearish, MATIC could have found a temporary support area to bounce from. The price chart also showed that the $2.06 level was a support level of some significance. Hence, this area (cyan box) can be used to enter a long position targeting the $2.25-$2.28 area. Further information would be necessary, but the evidence at hand suggested the $2.28 area was strong resistance and could be a place to look to short MATIC back to $2.06.