A sharp bounce for NEAR is well and good, but where’s the demand

Disclaimer: The findings of the following analysis are the sole opinions of the writer and should not be considered investment advice.
Bitcoin climbed above the $42.8k-level, and at the time of writing, was trading at $43.5k. Over the past week, Bitcoin has been rejected at $46k but it has also found some demand at the $41.8k-$42k area. If BTC bulls could drive the prices back towards $46k, it would be bullish for the rest of the market.
NEAR Protocol was trading at $10.83, at press time. Could a move upward for Bitcoin see gains for NEAR as well?
NEAR- 1 hour chart
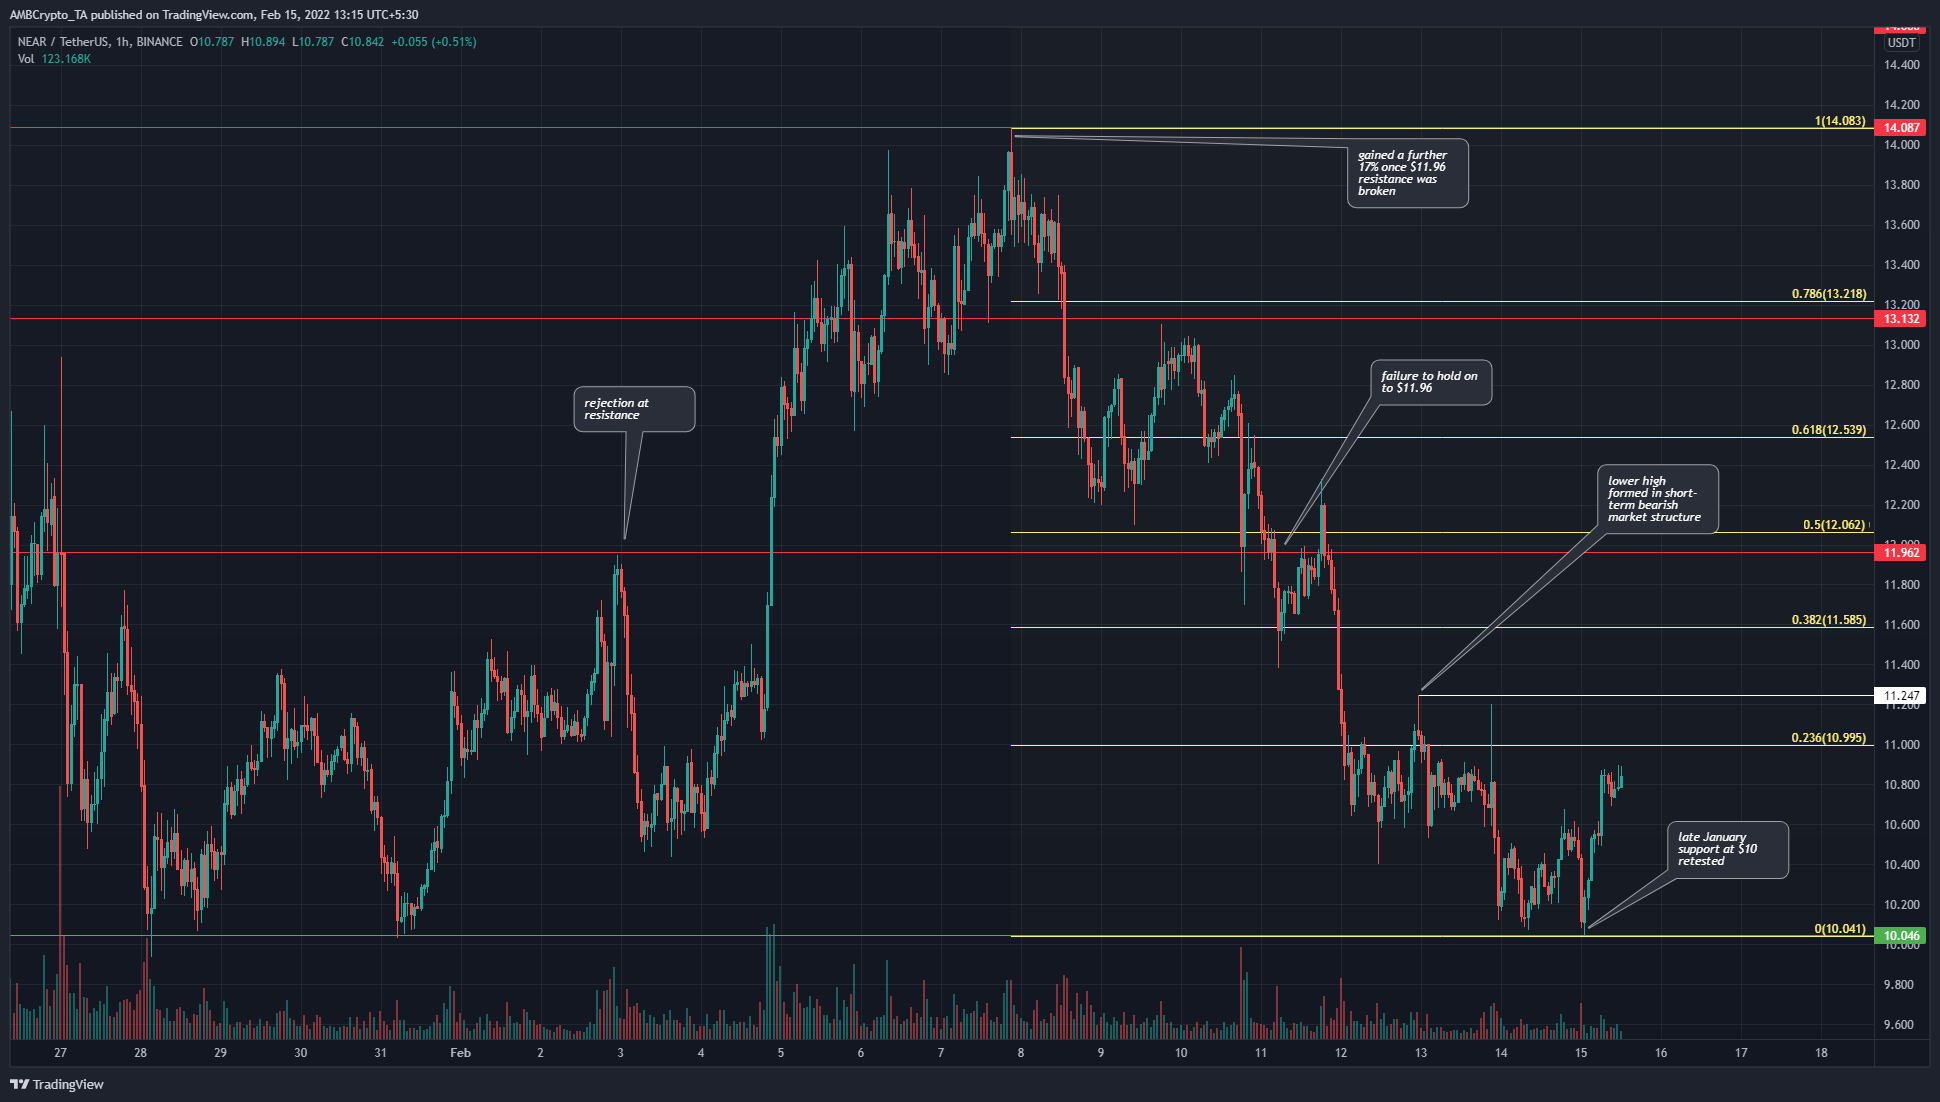
Using the swing high and swing low at $14.08 and $10.04, a set of Fibonacci retracement lines (yellow) were drawn. It showed the 23.6% retracement level for this move at $10.99, and this level will likely act as resistance for NEAR in the coming days.
The market structure of the past week has been bearish, especially once the $11.96-level was broken and flipped back to resistance. In late January, $11.96 rebuffed the bulls’ attempts to drive prices higher multiple times. Therefore, when NEAR broke above it in early February, it was followed by further gains.
Since the failure to hold on to $11.96, the price has revisited the support at $10.04 – A support level that has held well since January. In the longer-term, repeated tests of a support level with shallow bounces are a sign of weakness. But, in the short-term, these bounces offer buying opportunities.
Rationale
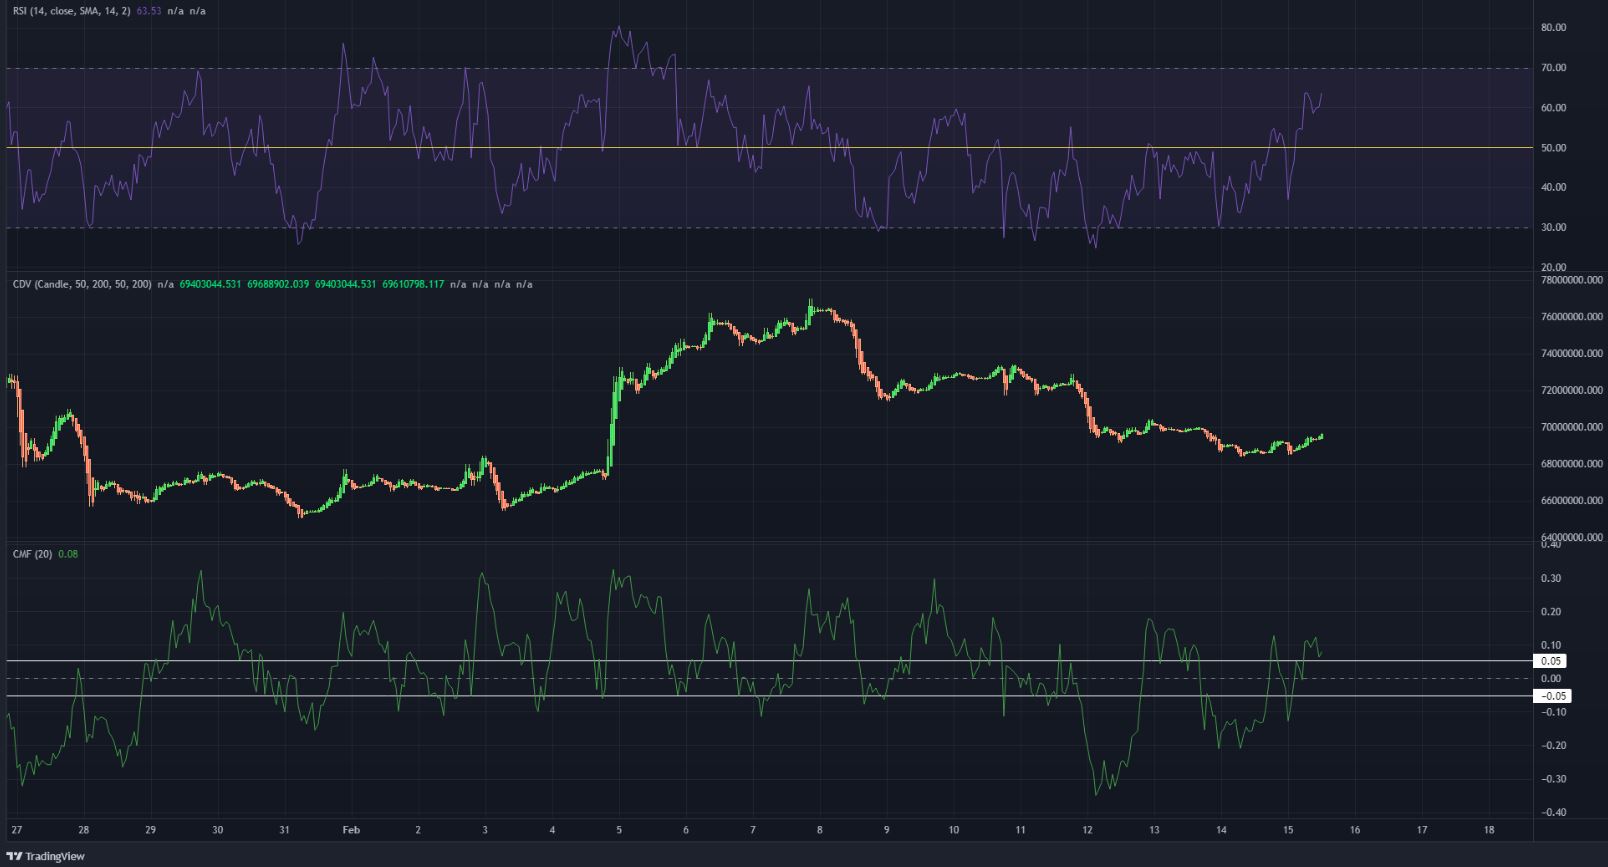
The RSI on the hourly chart climbed above neutral 50 and at the time of writing, stood at 63.5 – An indication of strong recent bullish momentum.
The Cumulative Delta Volume pictured the selling pressure grinding to a halt, but it did not yet show buying volume taking hold. To indicate genuine demand behind the rally, the CDV would need to begin an uptrend alongside the price.
The Chaikin Money Flow was just barely above the +0.05-level. This was a sign that capital flows were directed into the market.
Conclusion
The indicators showed that bullish presence is beginning to be felt. A move above $11.24 would break the short-term bearish market structure and above that, lay the $11.96 resistance level.
Hence, these are take-profit levels and might need further bullish vindication before they too can become areas to buy NEAR at.