Cosmos, Tron, THETA Price Analysis: 15 February

As the broader crypto market cap saw a 24-hour increase, ATOM broke out of its down-channel but faced a hurdle at the $29-level. Moreover, Tron and THETA upheld their immediate support after breaking down from their up-channels.
Cosmos (ATOM)
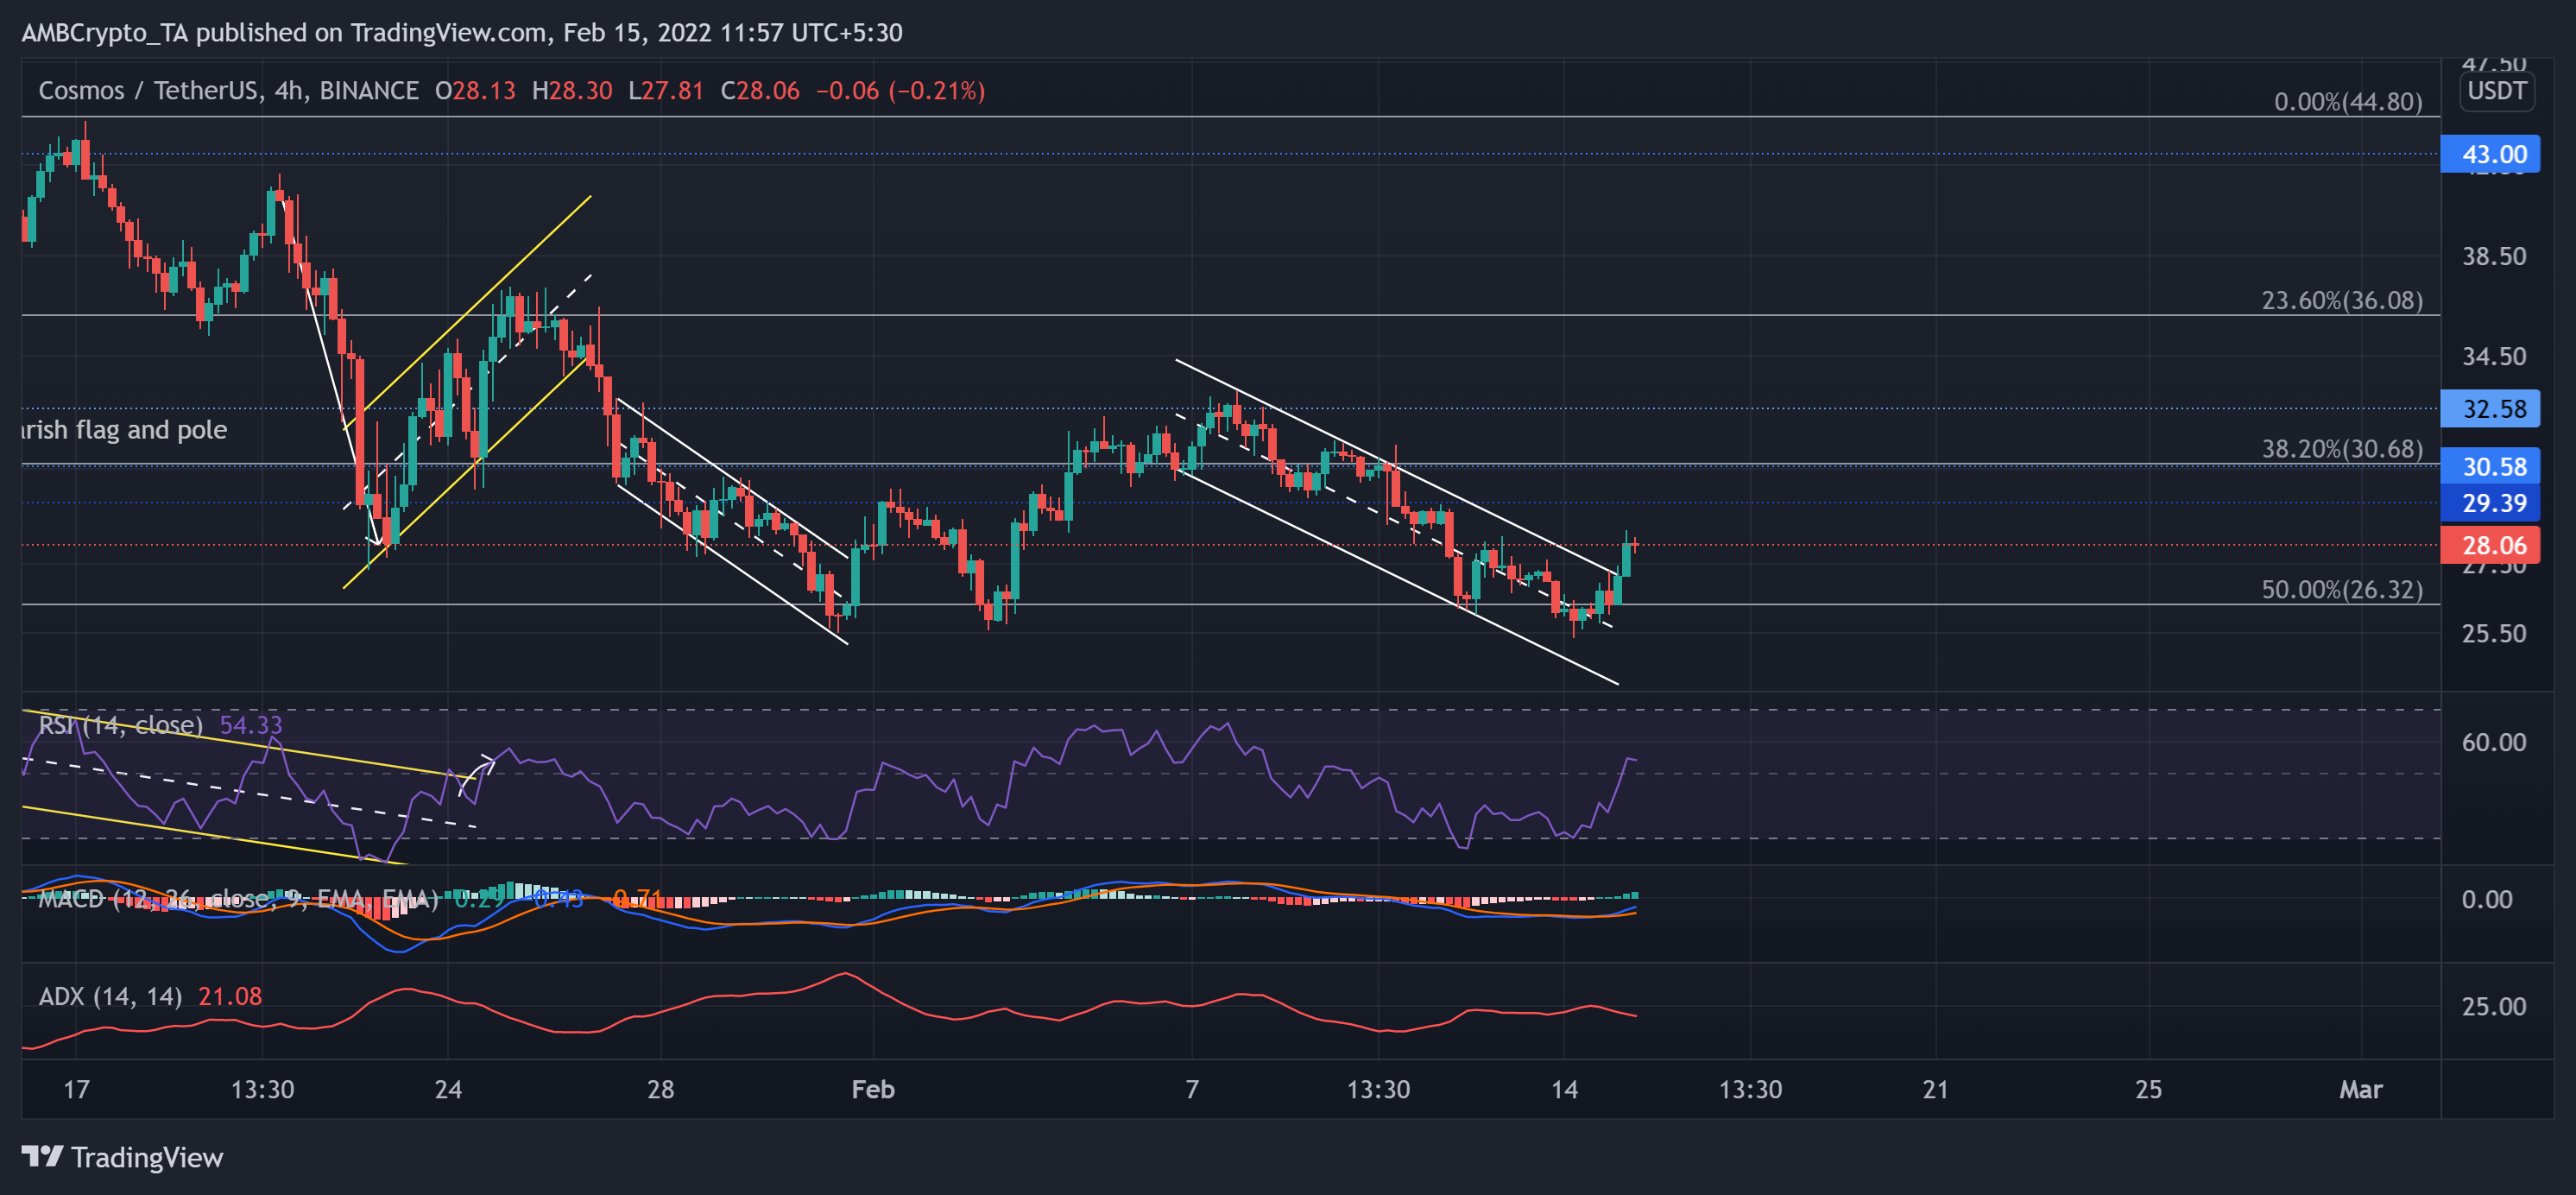
The sell-off phase led ATOM to lose 43.17% (from 17 January) of its value until 14 February. Thus, the all poked its seven-week low on 14 February.
ATOM saw a breakdown after forming a bearish flag and pole on its 4-hour chart. It steeply dropped to lose support at the 38.2% Fibonacci level. Over the past day, ATOM saw a down-channel (white) breakout. Now, the immediate testing grounds for the bulls stood at the $$29-$30 range. Besides, any pullbacks would continue to find support at the $26-mark.
At press time, ATOM traded at $28.06. The RSI found a close above its equilibrium as the alt registered a 9.42% 24-hour gain. Further, the MACD histogram maintained itself above the zero-line. But its lines still needed to close above the zero line to confirm a change in trend. To top it up, the ADX displayed a weak directional trend ATOM.
Tron (TRX)
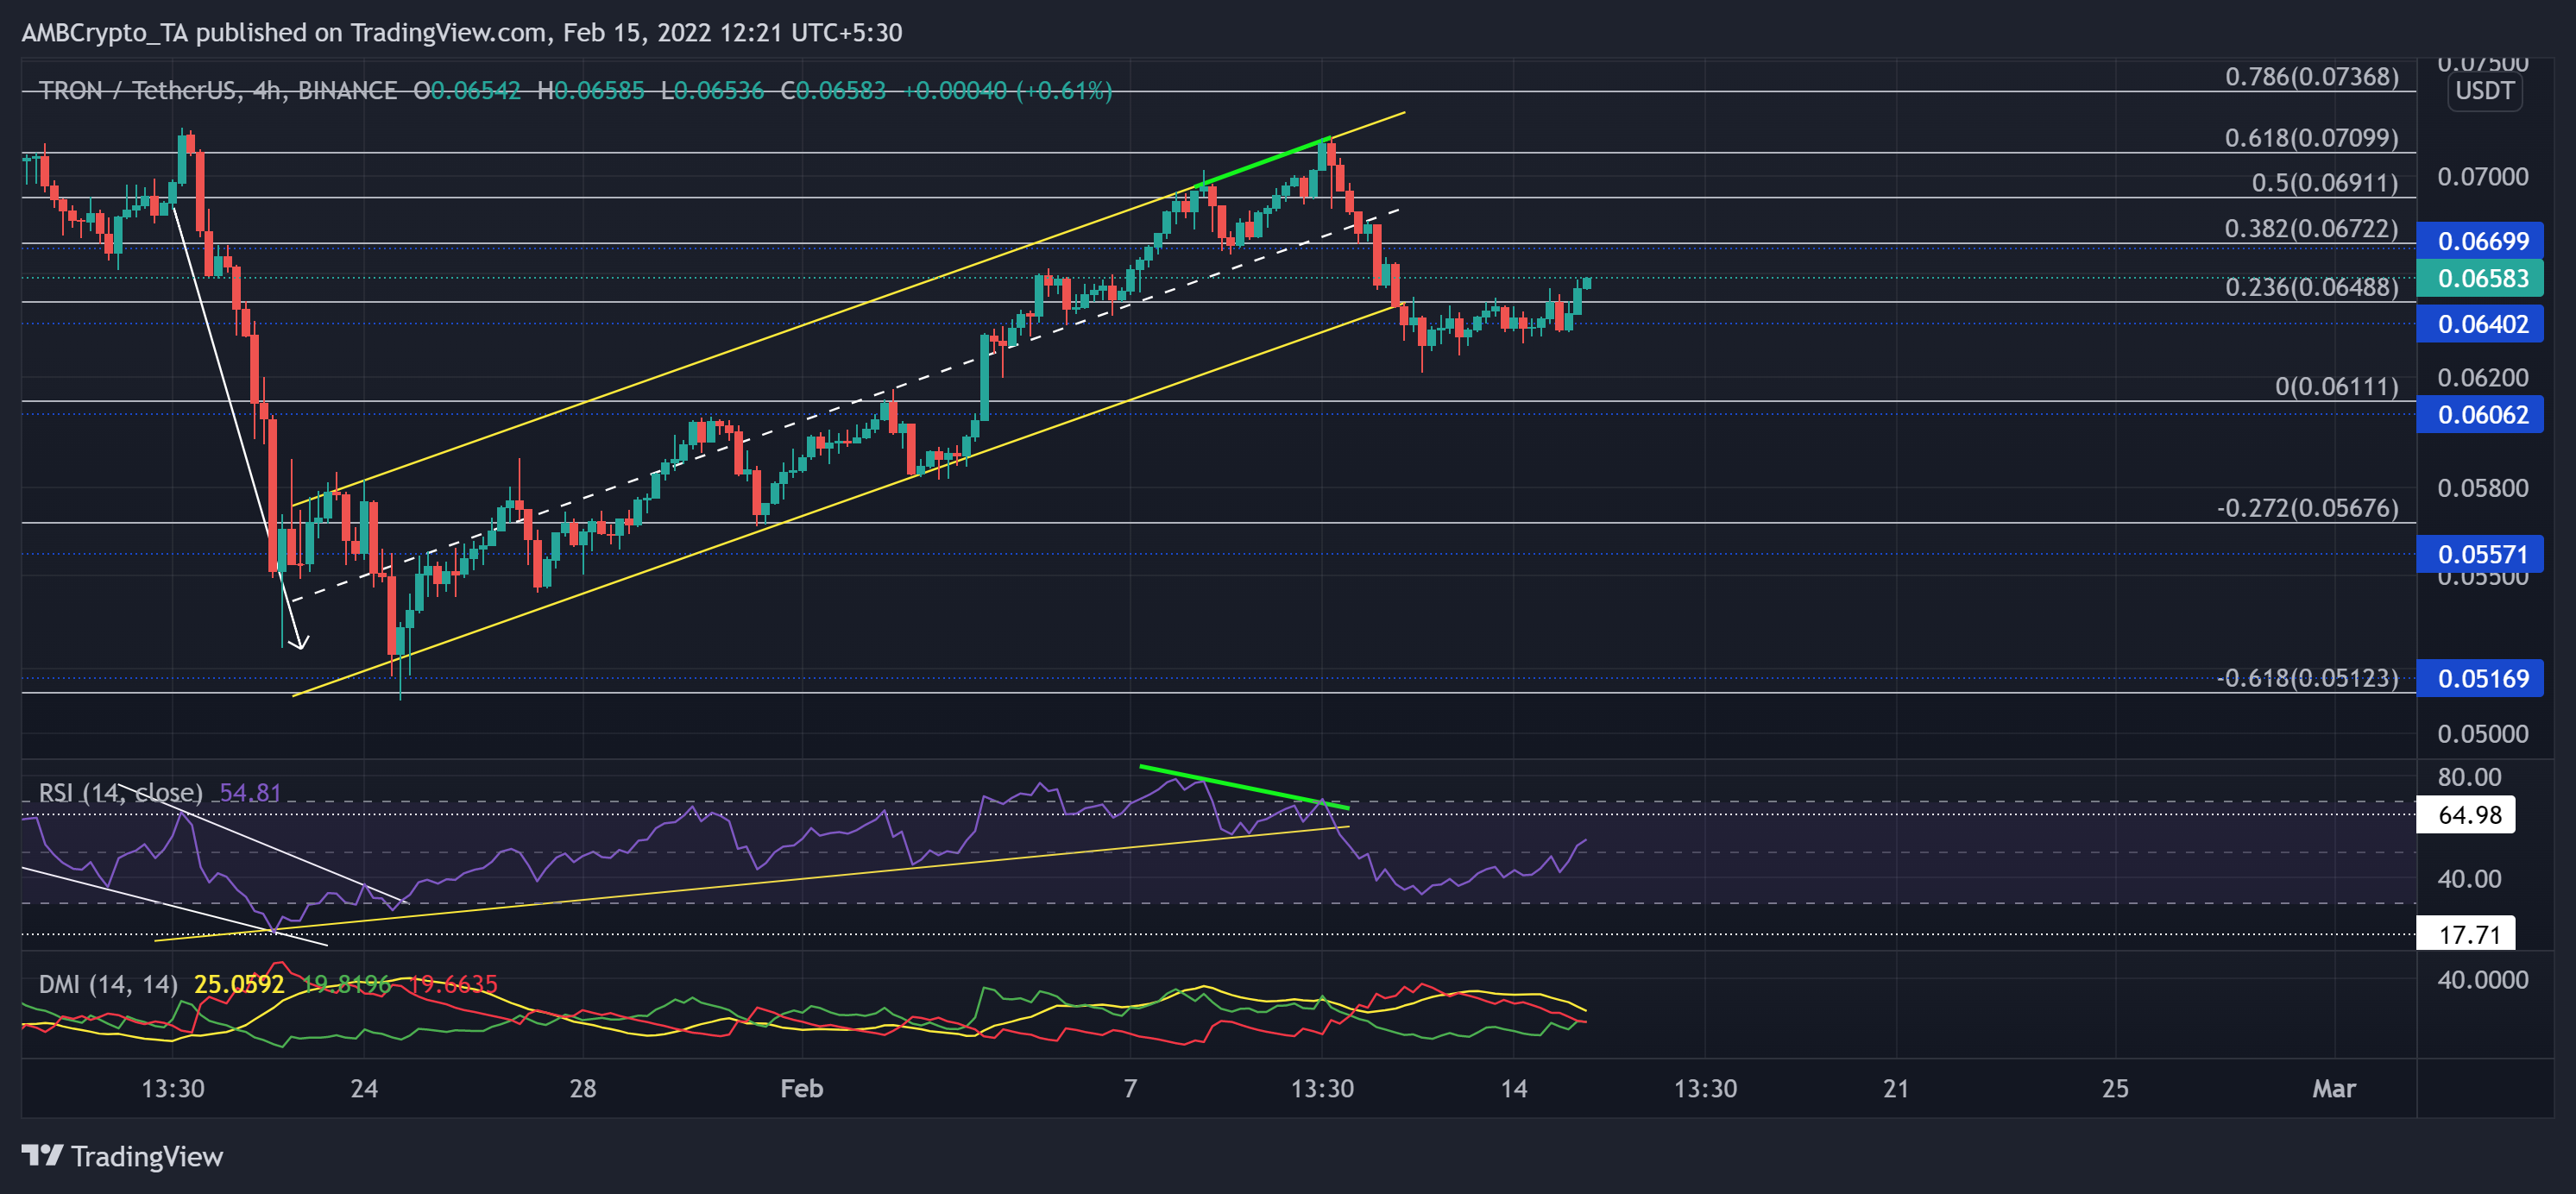
After reversing from the 61.8% Fibonacci resistance on 20 January, TRX witnessed a substantial drop. The alt registered a 29.1% decline in just four days and touched its six-month low mark on 24 January.
Since then, TRX saw an ascending channel on its 4-hour chart and recovered its previous losses. The alt grew by over 39% to retest the golden Fibonacci level until breaking down of the up-channel. Nevertheless, the $0.064 support stood strong as TRX endeavored to test the 38.2% resistance.
At press time, TRX was trading at $0.06583. After forming a bearish divergence (green) with price, the RSI snapped its trendline support (yellow). But showed a decent revival in the last few days by being northbound above the half-line. Further, the DMI lines were on the verge of a bullish crossover, depicting a bullish comeback possibility.
Theta Network (THETA)
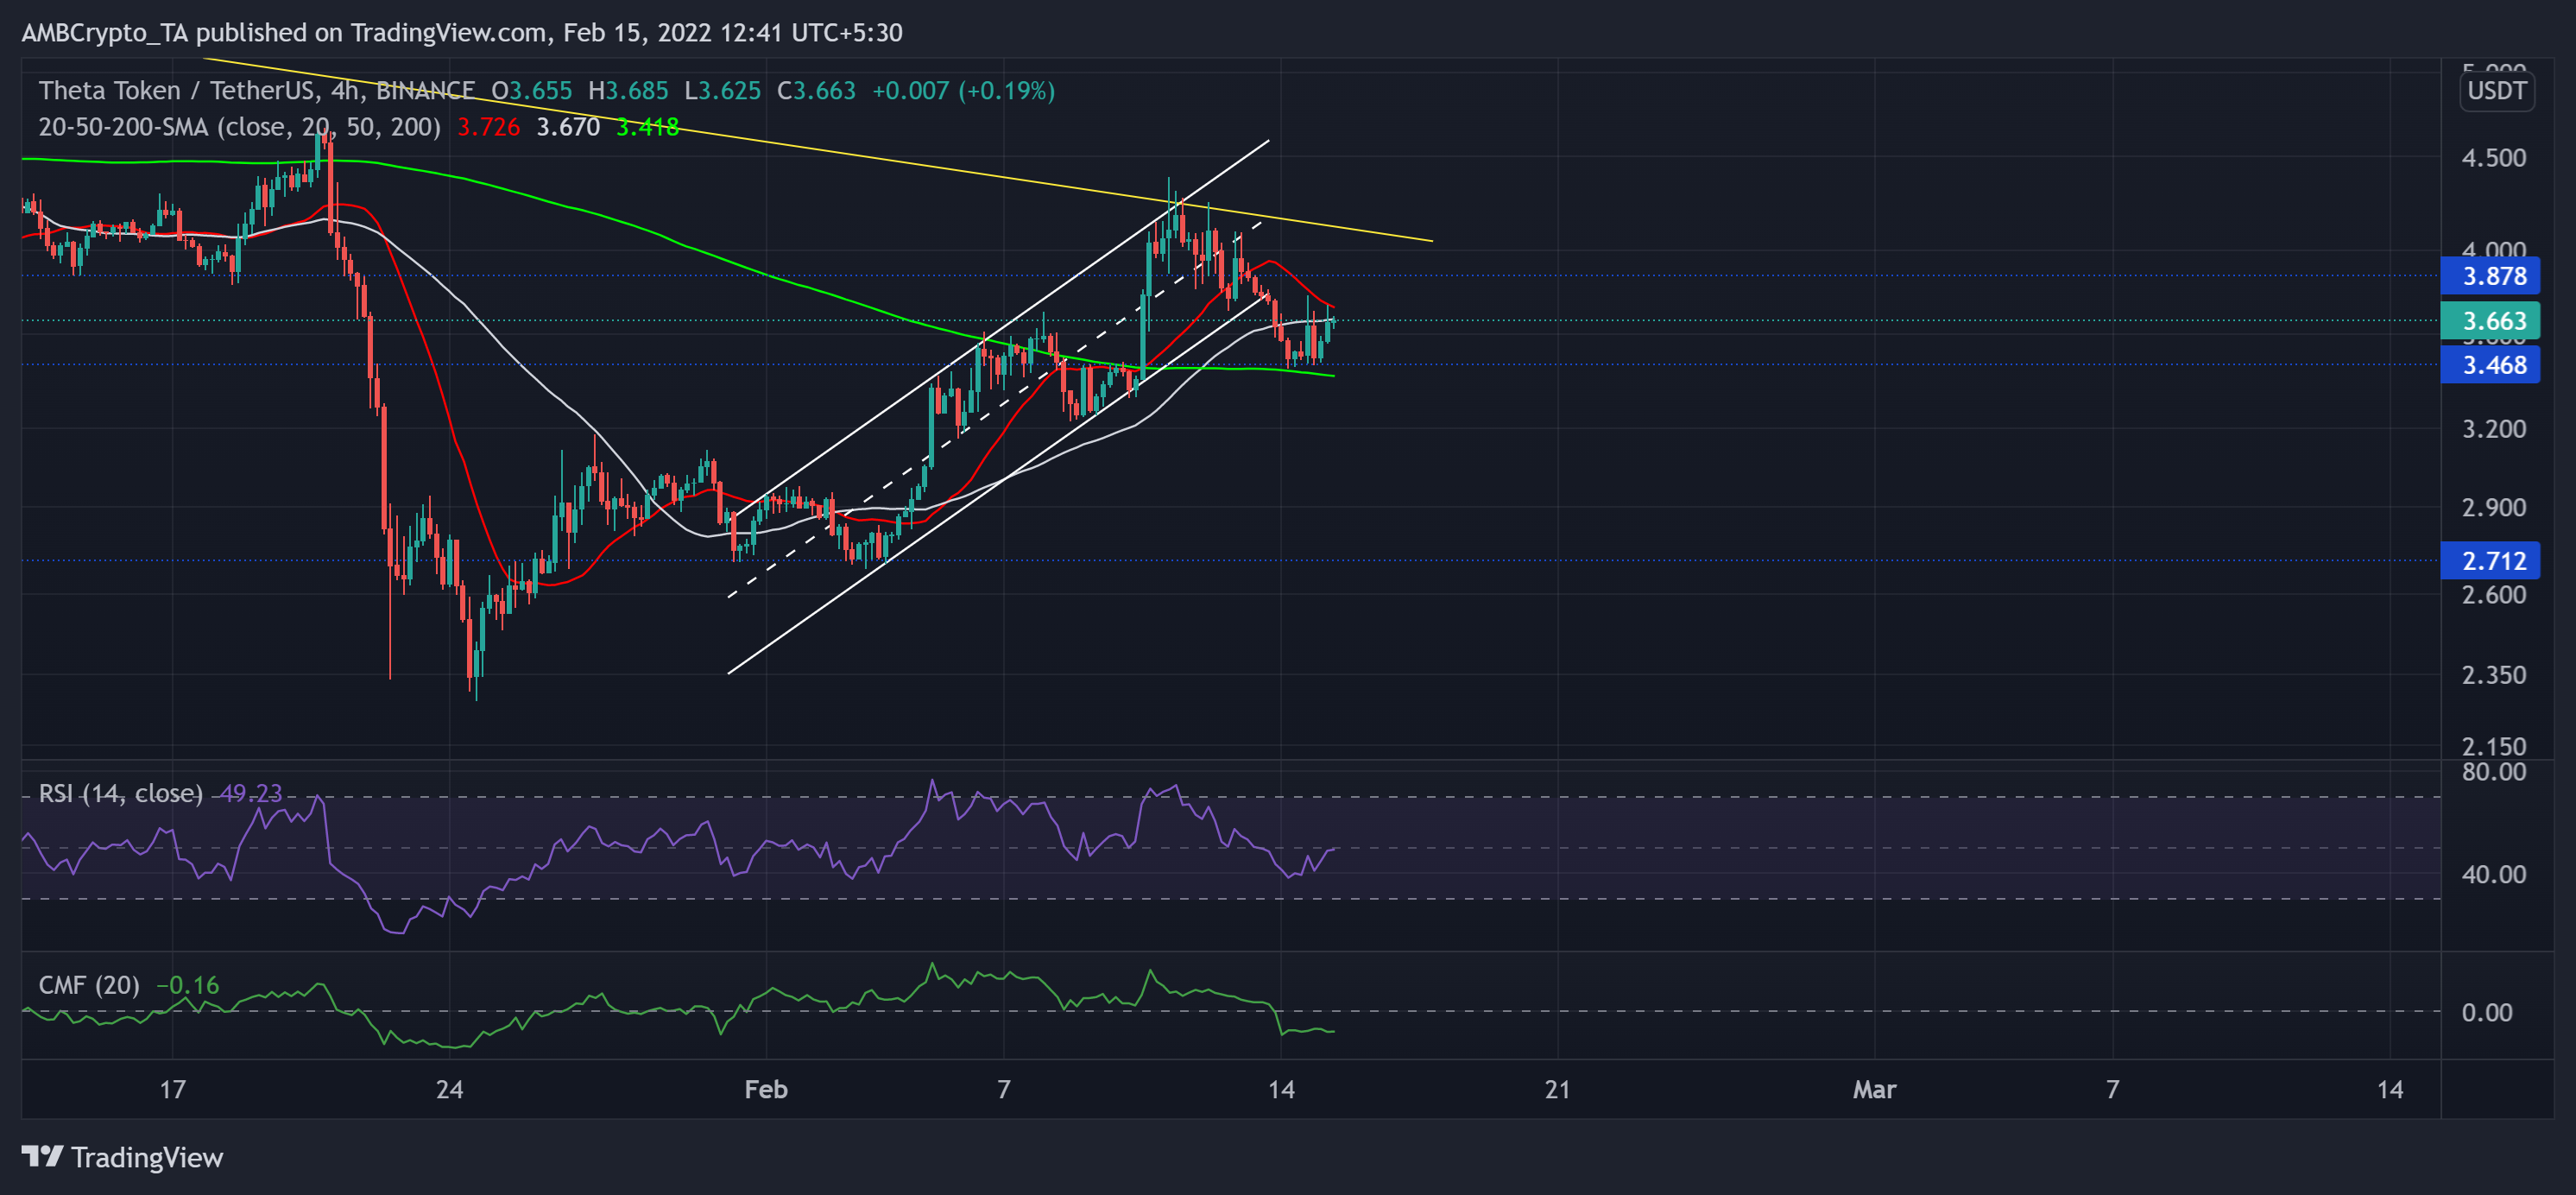
The altcoin has been on a steady downtrend since early November. As a result, it lost its vital 11-month support (now resistance) at the $3.8-mark.
Over the last few days, as the buyers finally stepped in at the $2.7-mark, THETA saw an up-channel (white) on its 4-hour chart. As the rally halted at its three-month-long trendline resistance (yellow), it saw a pullback towards the $3.4-level (immediate support). Now, if the 20 SMA (red) falls below the higher timeframe SMA’s, it would confirm the decreasing buying influence.
At press time, THETA traded at $3.663. The RSI plunged below the half-line. Any close above this level would propel a retest of the $3.8-resistance. Nevertheless, the CMF still struggled to cross the zero-line, depicting a bearish edge.