AAVE hits $85: Can it cross pre-FTX levels?
AAVE's bullish streak hits July levels. Can it extend to the pre-FTX level of $95?

Disclaimer: The information presented does not constitute financial, investment, trading, or other types of advice and is solely the writer’s opinion.
- AAVE hit $85, a Q3 high, amidst a weekend pump.
- A stack of liquidation levels was left at $76 and could attract a pullback.
The October market recovery extended over the weekend (21/22 October) as Bitcoin [BTC] reclaimed the $30k level. The rest of the altcoins followed suit, with Aave [AAVE] hitting July levels of $85.
Is your portfolio green? Check out the AAVE Profit Calculator
A recent AAVE price analysis report on 21 October established that the growing long positions could push the altcoin past $70. The projection was validated as AAVE zoomed to July’s level of $85. Can bulls go to the next target and pre-FTX level of $95?
The next bullish target existed at $95
In less than four days (19-23 October), AAVE’s bullish streak saw more than 38% gains after hitting July levels at $85.
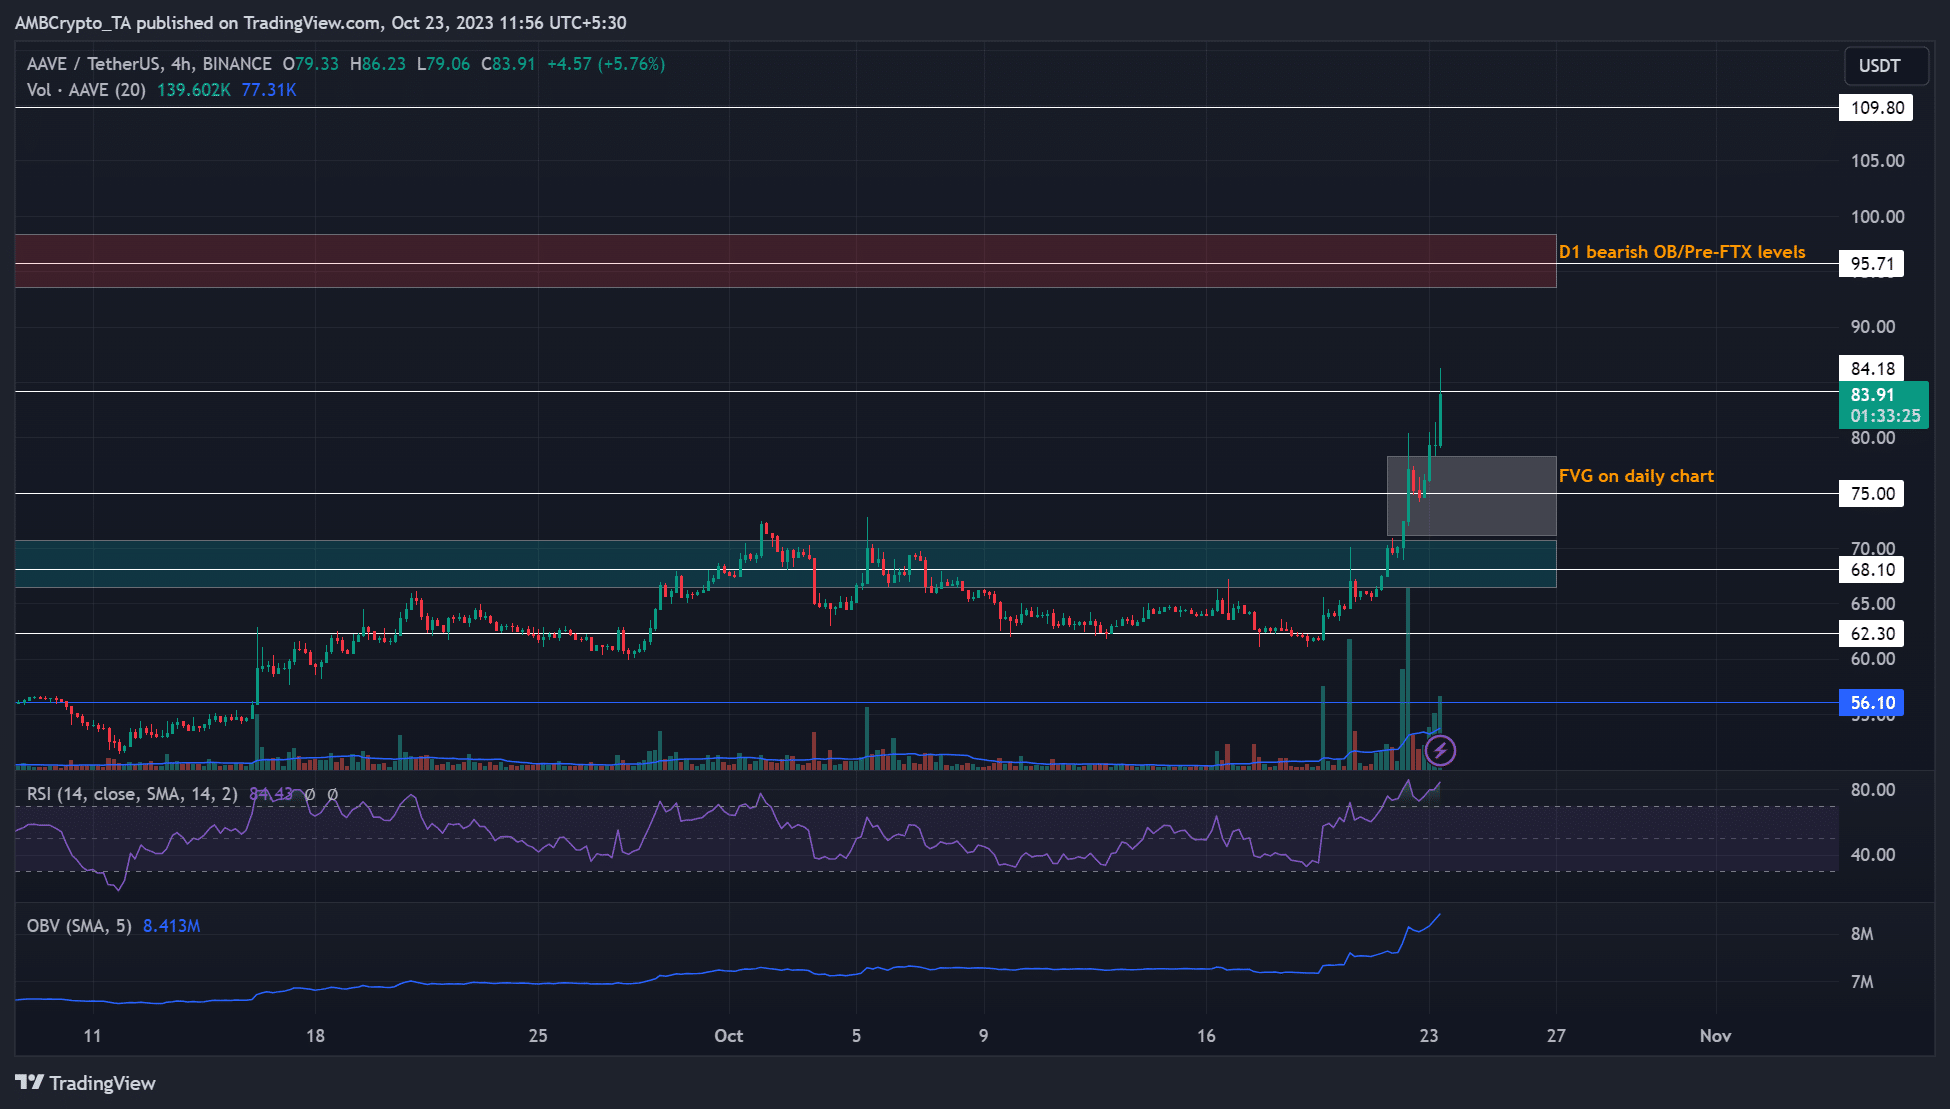
Over the weekend, the RSI remained in the overbought zone, highlighting the intense buying pressure behind the altcoin. The OBV has also improved since mid-September, underscoring the steady increase in demand for AAVE over the same period.
At press time, price action had cleared the $70 and $75 hurdles, but was yet to bypass the $85 resistance. Notably, the $85 level was a July high price zone. The next bullish target was the bearish order block (OB) and the pre-FTX level of $93.4 – $98.4 (red).
A rejection at $85 could inflict a pullback to the price imbalance and FVG (Fair Value Gap) on the daily chart of $71.2 – $78.3 or the $70 psychological level.
A high liquidation zone existed at $76

Based on Hyblock Capital data, the $76 area was a high liquidation level, as shown by the orange color. Nevertheless, the stack of medium liquidation levels was slightly above $85.
Read Aave’s [AAVE] Price Prediction 2023-24
For perspective, high liquidation zones indicated risk levels for leveraged traders, and prices tend to hit these zones due to liquidity hunt.
Therefore, a pullback could head to the high liquidation level of $76, which was within the FVG on the charts. So, a retracement could ease around $76 should AAVE falter at the overhead hurdles.