AAVE investors, up for buying opportunities should take a position here

Disclaimer: The findings of the following analysis are the sole opinions of the writer and should not be considered investment advice
A recent report highlighted how AAVE and its metrics looked to be foreshadowing a bullish reversal from the $161 lows. The $170 and $160 are levels of technical and historical importance, respectively.
Bitcoin has tested the $38.8k demand region again, and if it can see some notable upside, the shift in market sentiment could affect AAVE positively. The coin itself has not seen strong selling volumes, despite the sharp drop in price. This suggested that further upside could be possible for AAVE in the weeks to come.
AAVE- 1 Day Chart
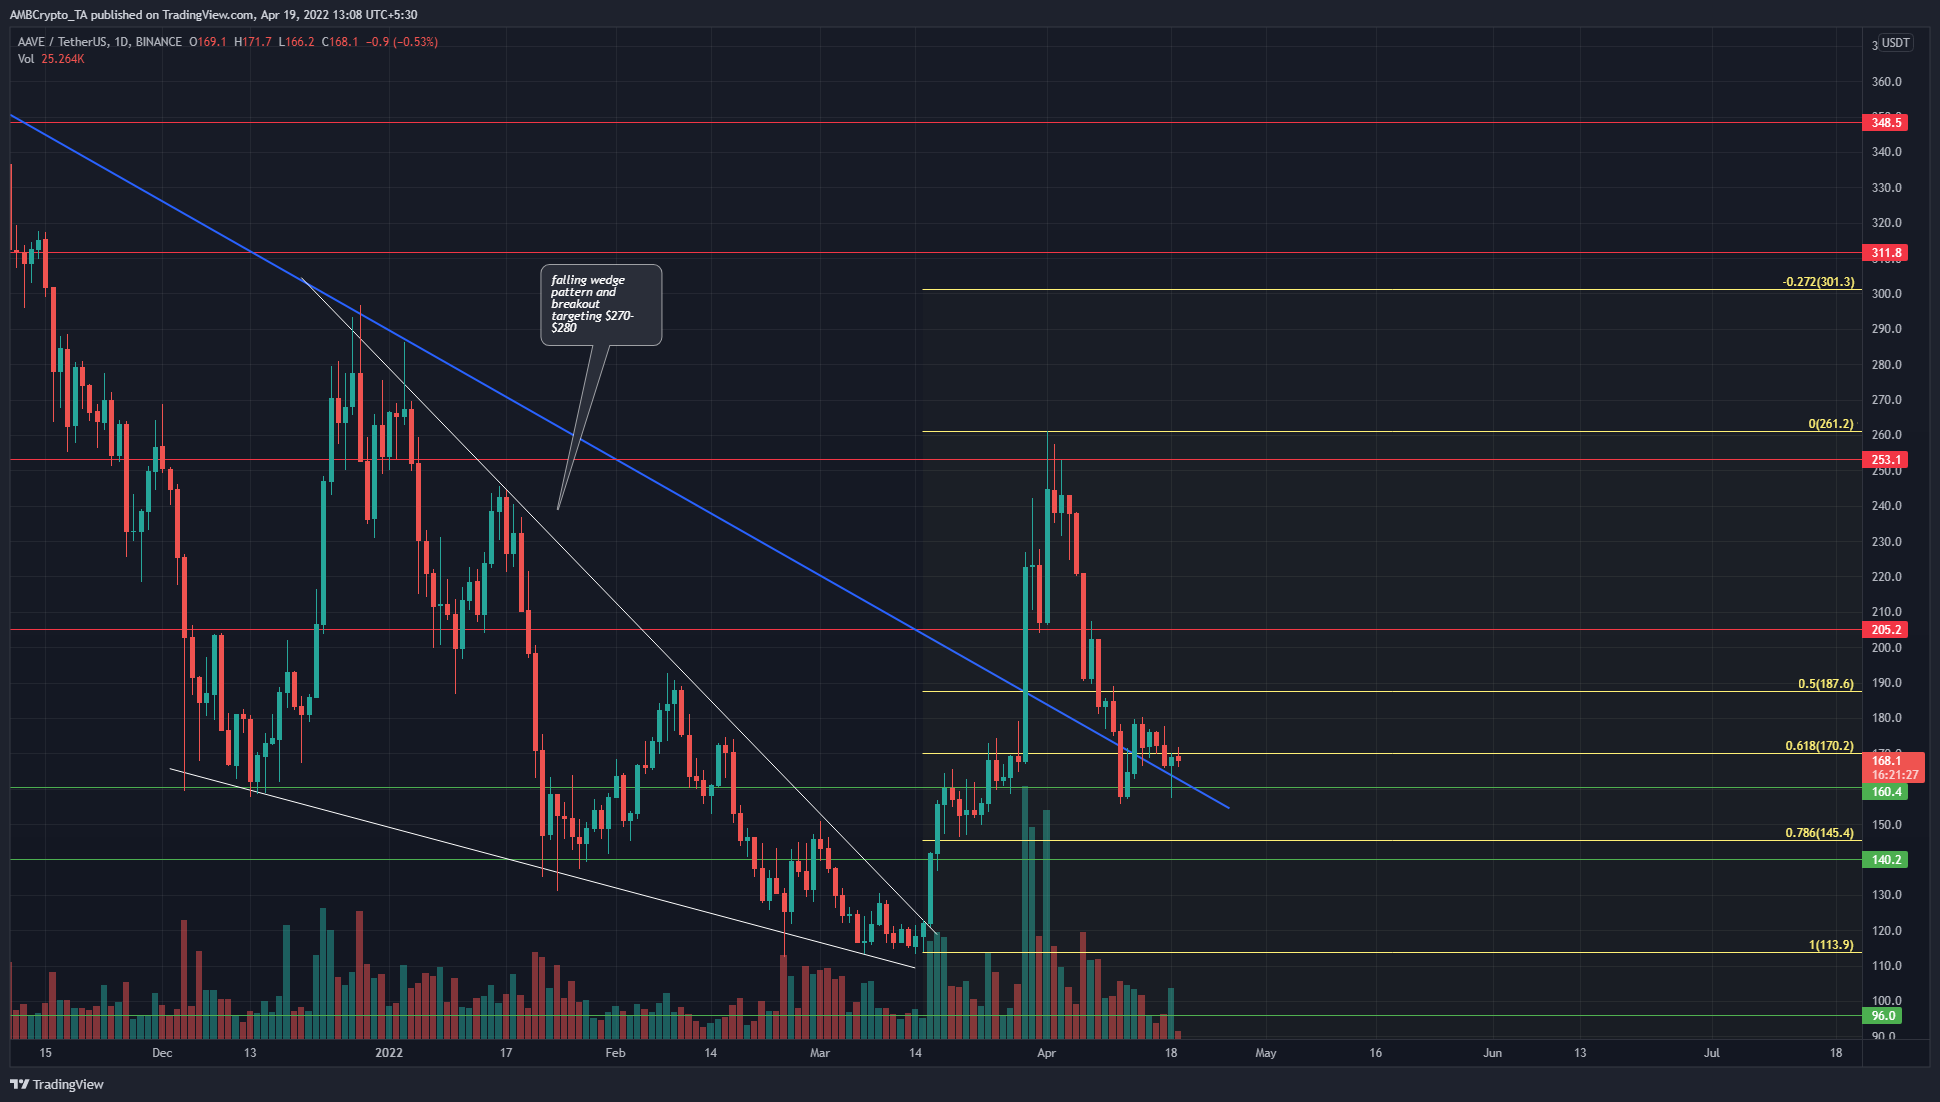
In white is a falling wedge pattern that AAVE traded within from December to mid-March. The price broke out of this pattern later in the same month. It also broke past a descending trendline resistance (blue) stretching back to August 2021.
Based on the swing high and low at $113.9 and $261.2, a set of Fibonacci retracement levels (yellow) was plotted. They showed that the $145-$170 region was a place where long-term investors could look to buy the token. This is because the 61.8%-78.6% retracement levels are levels to which the price generally retraces, before continuing on a larger wave upward.
Moreover, these retracement lines had long-term support levels nearby, at $160 and $140. Dollar-cost averaging could be a way to enter a long position.
Rationale
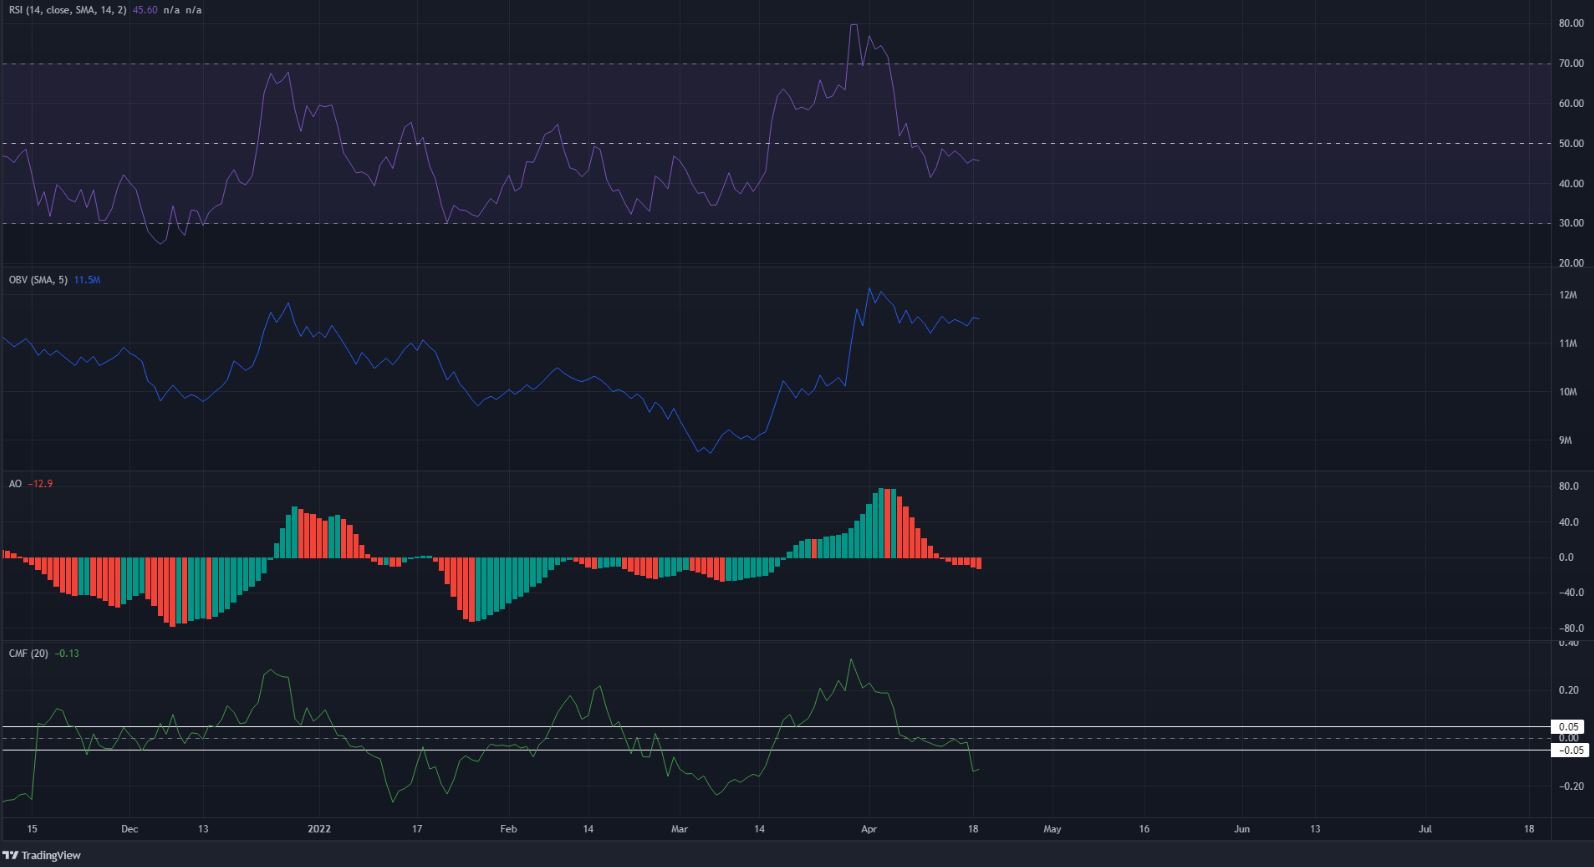
The indicators, particularly the momentum indicators, reflected the bullishness that AAVE had seen in the past few weeks as it shot upward from $113 to $260. The RSI retreated back to neutral 50 in response to the deep retracement, and the Awesome Oscillator was also just beneath the zero line. This showed that, at the time of writing, the momentum did not favor either the buyers or the sellers.
The Chaikin Money Flow slipped beneath the -0.05 line in the past few days as selling intensified. However, the OBV stood strong and saw only a shallow dive, even though the price has fallen by nearly 35% since the $260 local highs.
Conclusion
Even though the price has taken a nosedive, the selling volume has not been particularly intense. Buying opportunities on lower timeframes could arise in the $140-$160 area for AAVE in the days or weeks to come.