Aave, Maker, DigiByte Price Analysis: 13 March

Aave regained the 38.2% Fibonacci retracement level and could see some additional buying at the current mark. Gains on MKR were likely to be capped at the 200-SMA, while DGB could remain sandwiched between two Fibonacci levels without a pickup in buying activity.
Aave [AAVE]
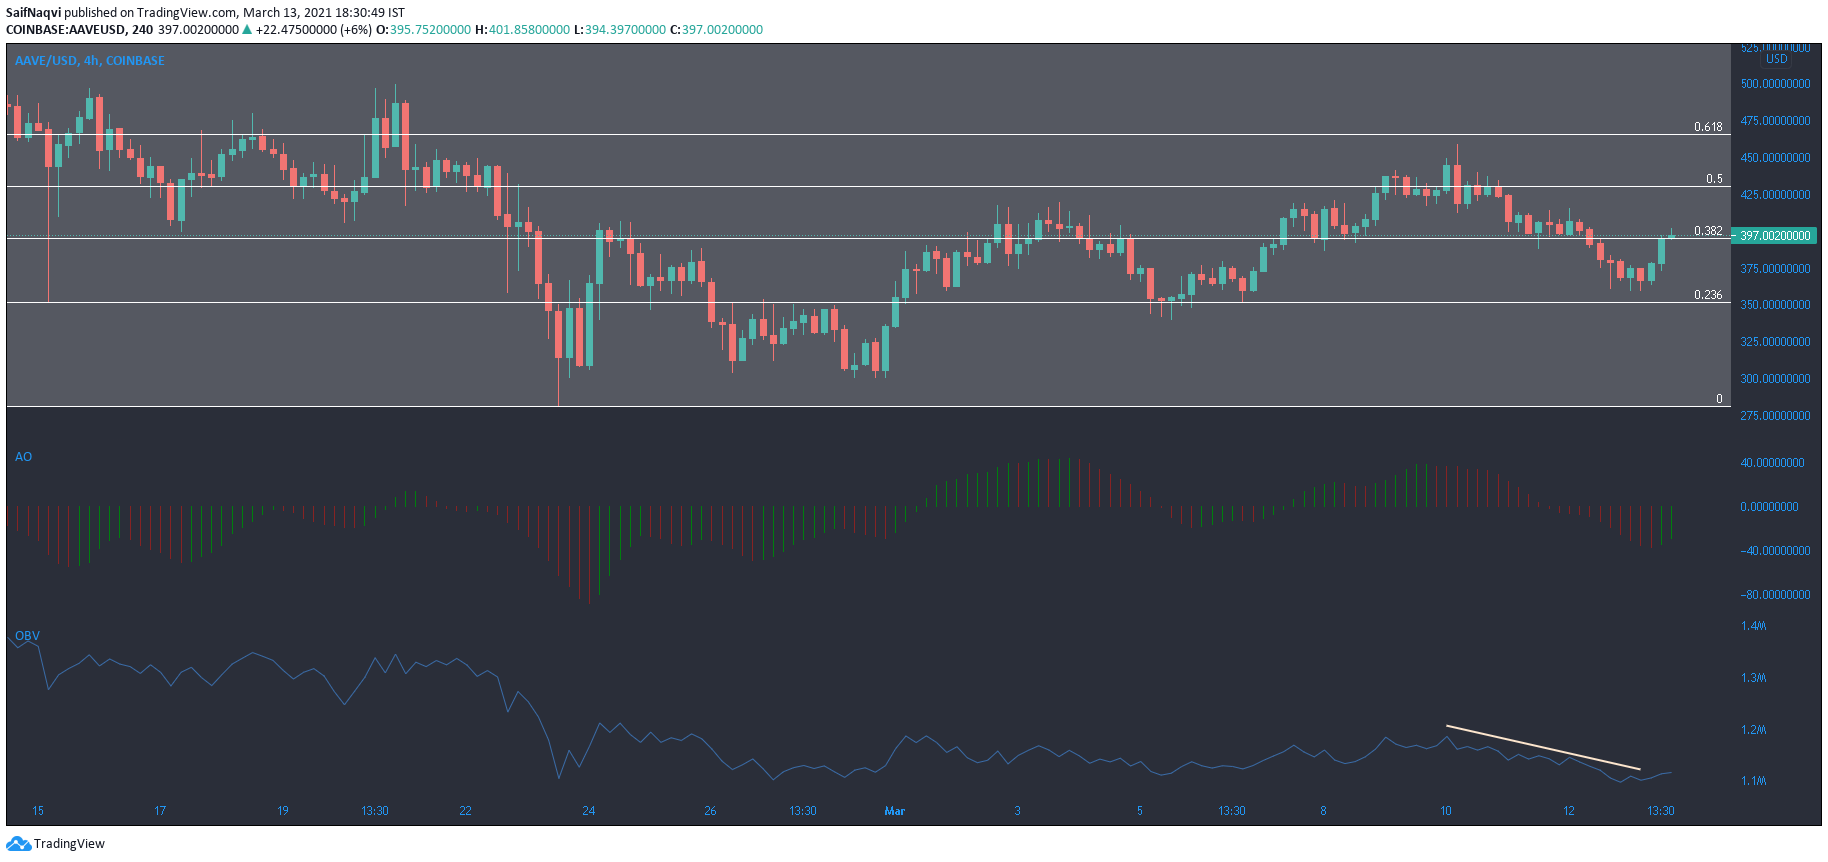
Using Aave’s drop from $580 to $301, some important Fibonacci levels were highlighted on the 4-hour timeframe. At the time of writing, the crypto asset recaptured the 38.2% Fibonacci retracement level at the $400 mark. The current region has served as a base for some buying activity over the past week, and the same was expected on this occasion as well.
The Awesome Oscillator registered consecutive green bars as momentum grew on the buying side. The OBV, which had formed a series of lower lows over the past few sessions, also picked up.
Maker [MKR]
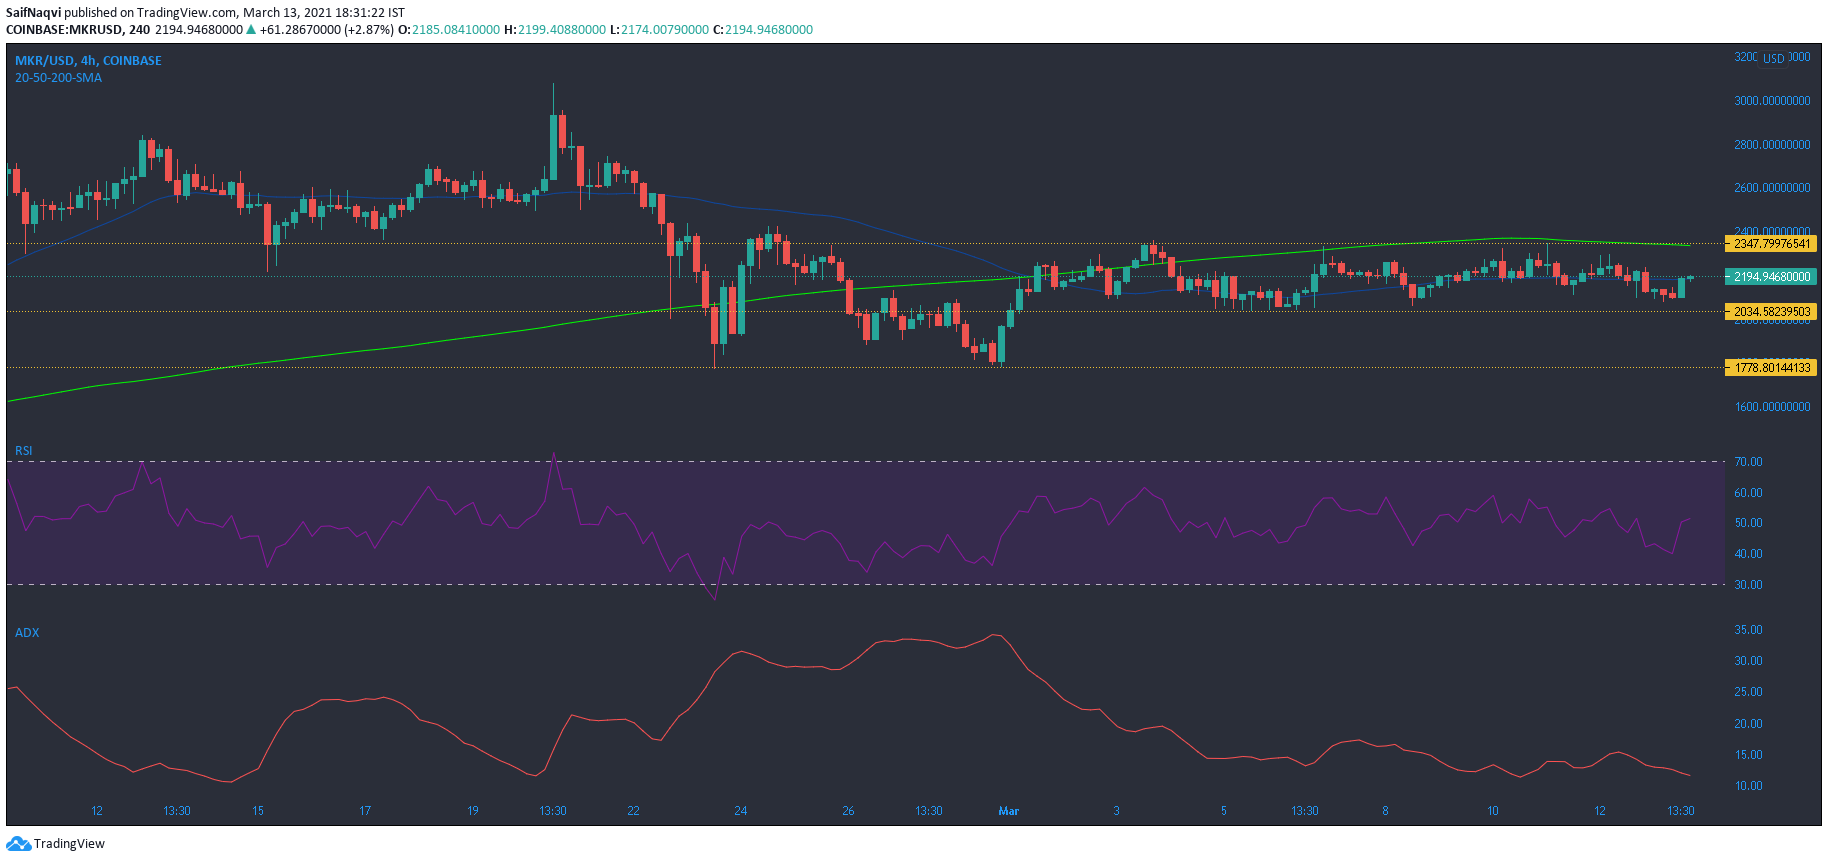
Bullish cues from the broader market did not reflect in Maker’s price and the cryptocurrency resumed its rangebound movement between $2,347 and $2,034. In fact, the upper ceiling formed a formidable resistance as it also coincided with the 200-SMA (green).
The RSI floated at the 50-level as equilibrium was maintained between the buying and selling side. The ADX pointed lower from the 10-mark and showed the lack of a strong trend. The neutrality maintained by the indicators suggested that MKR could continue to move within its current channel in the short-term. A spike in the 24-hour trading volumes could signal a potential shift from a consolidating market.
DigiByte [DGB]
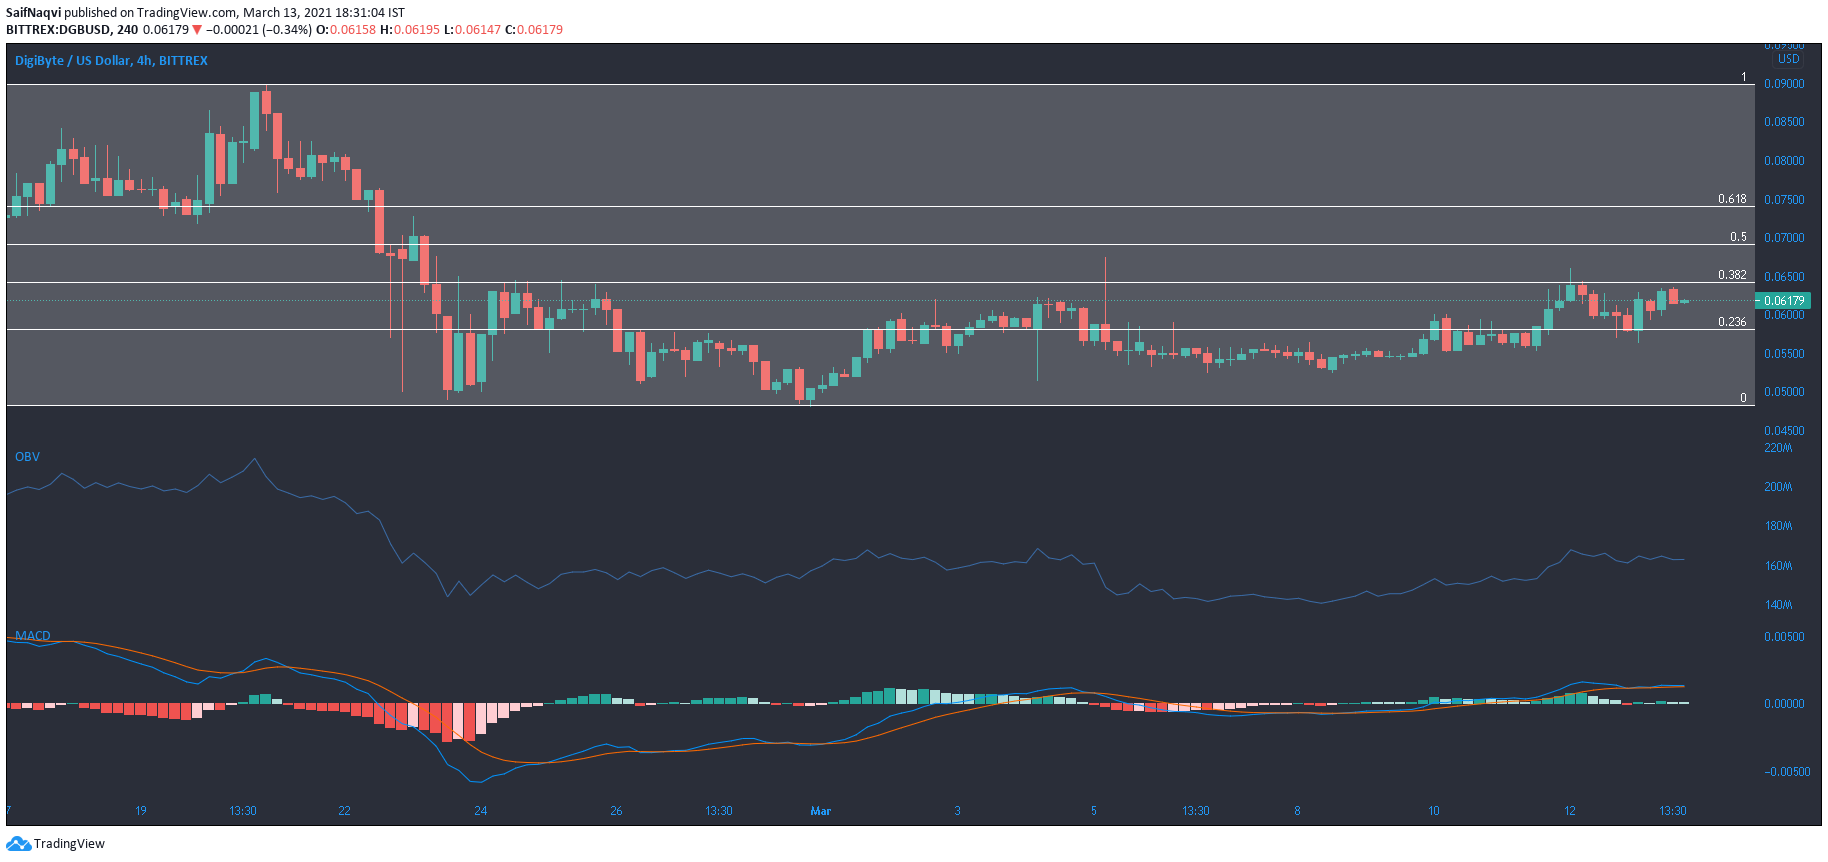
DigiByte remained below its 38.2% Fibonacci retracement level at the time of writing, a region that has not been breached for well over two weeks. The OBV remained choppy and showed a lack of constant buying pressure since DGB’s fall towards $0.05 support.
The MACD line was almost superimposed on the signal line, while the histogram was bullish-neutral. The current stance of the indicators did not weigh heavily towards an upwards breakout and DGB could remain below the coveted upper ceiling over the coming sessions. However, it would be interesting to monitor the DGB market if it prices in bullish cues from the market leader Bitcoin.


