AAVE price prediction – September’s high falls, but is $200 next?
Buyers should expect further gains, but short-term liquidity pools could induce volatility soon.

- AAVE established a bullish market structure after last week’s drop below its local support
- A rally beyond $200 appeared likely in the short term
Aave [AAVE] rallied by 49.7% in the last five days, pushing past its local high at $180.74. The altcoin had established the $137-$140 region as support, but declined below it on 4th November.
This deviation was followed by a swift rally, establishing the bullish intent behind AAVE. Further gains can be anticipated though and the $206 resistance is the next target. And yet, there is a chance that the $190-zone could delay the bulls.
AAVE flips $180 to support
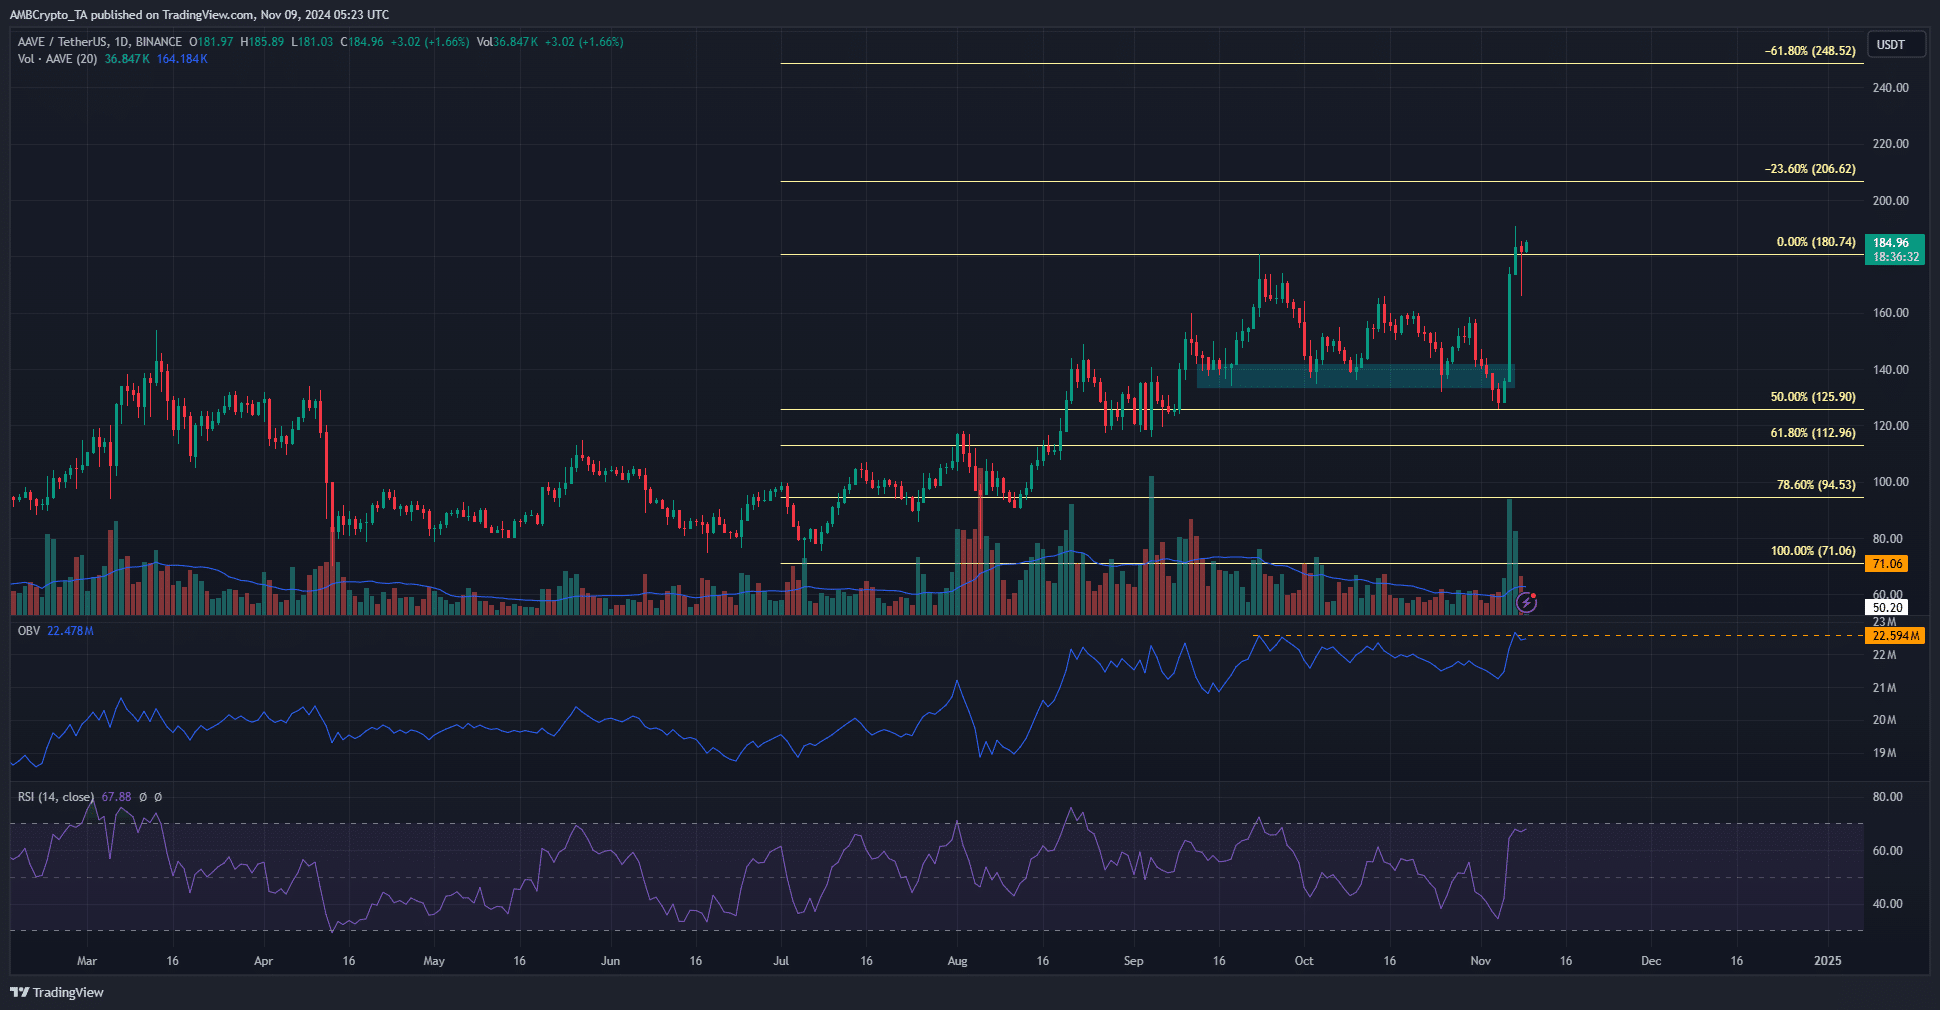
On 7 November, AAVE climbed beyond the September high at $180.7. It saw heightened volatility on 8 November, but the bulls were able to defend the $180-level as support.
The Fibonacci extension levels at $206 and $248 would be the next bullish targets. The RSI on the daily chart decisively climbed above neutral 50. Alongside the price action, it signaled more gains were likely. However, the OBV struggled to clear the local high from mid-September.
This seemed to be a warning that buying pressure needs to be sustained to enhance the chances of an AAVE uptrend. However, at press time, the price action was encouraging for the bulls and long positions were feasible.
Liquidity pools could induce volatility
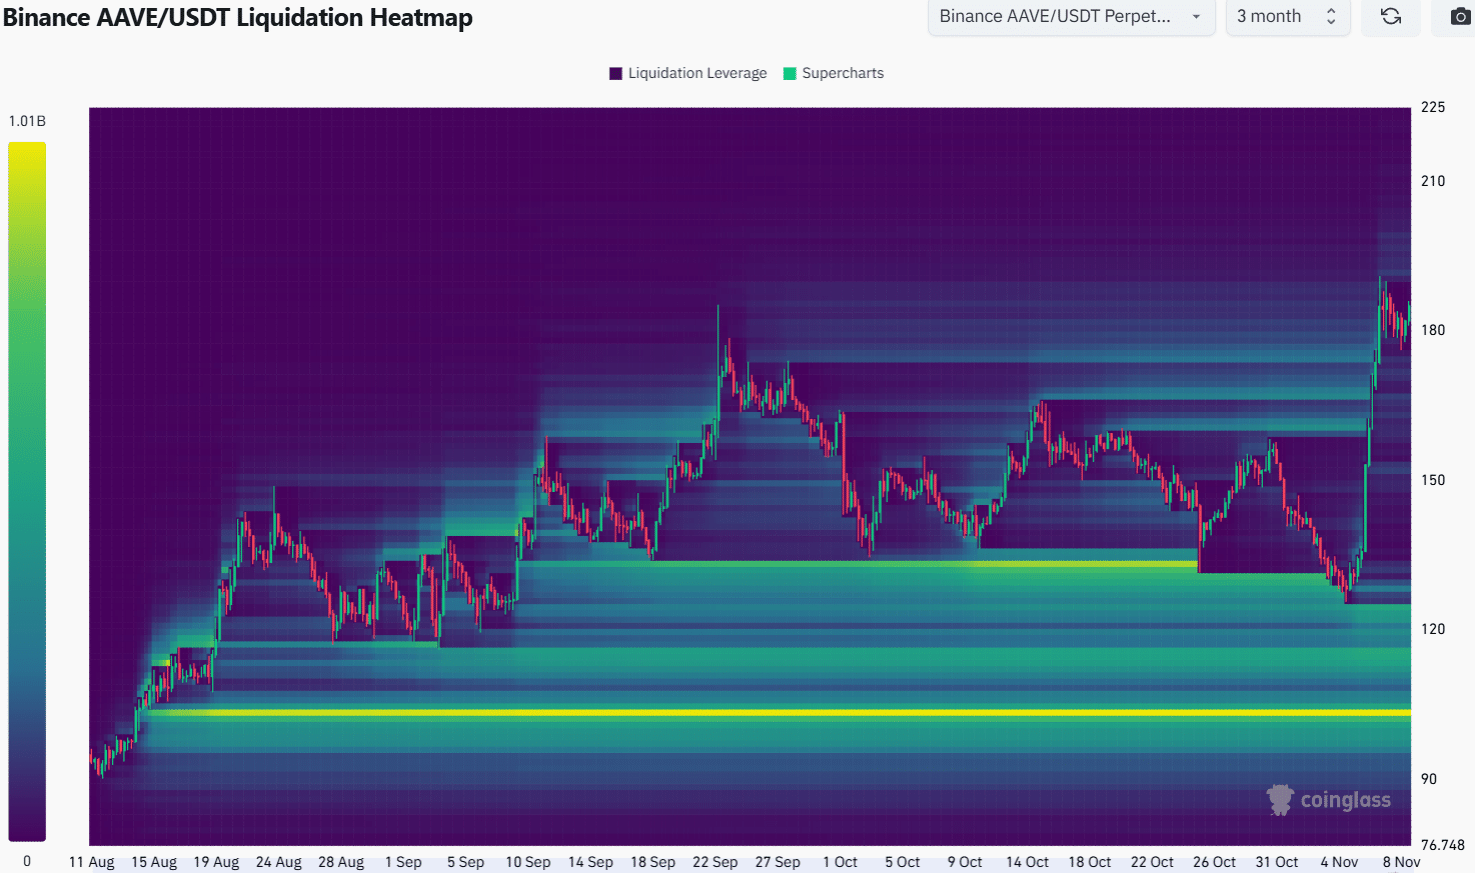
The 3-month look-back period heatmap outlined the $133, $128, and $121 as regions with considerable liquidity. The first two were swept in the second half of October.
The bullish sentiment behind Bitcoin [BTC] helped AAVE rebound strongly after the deviation below $130.
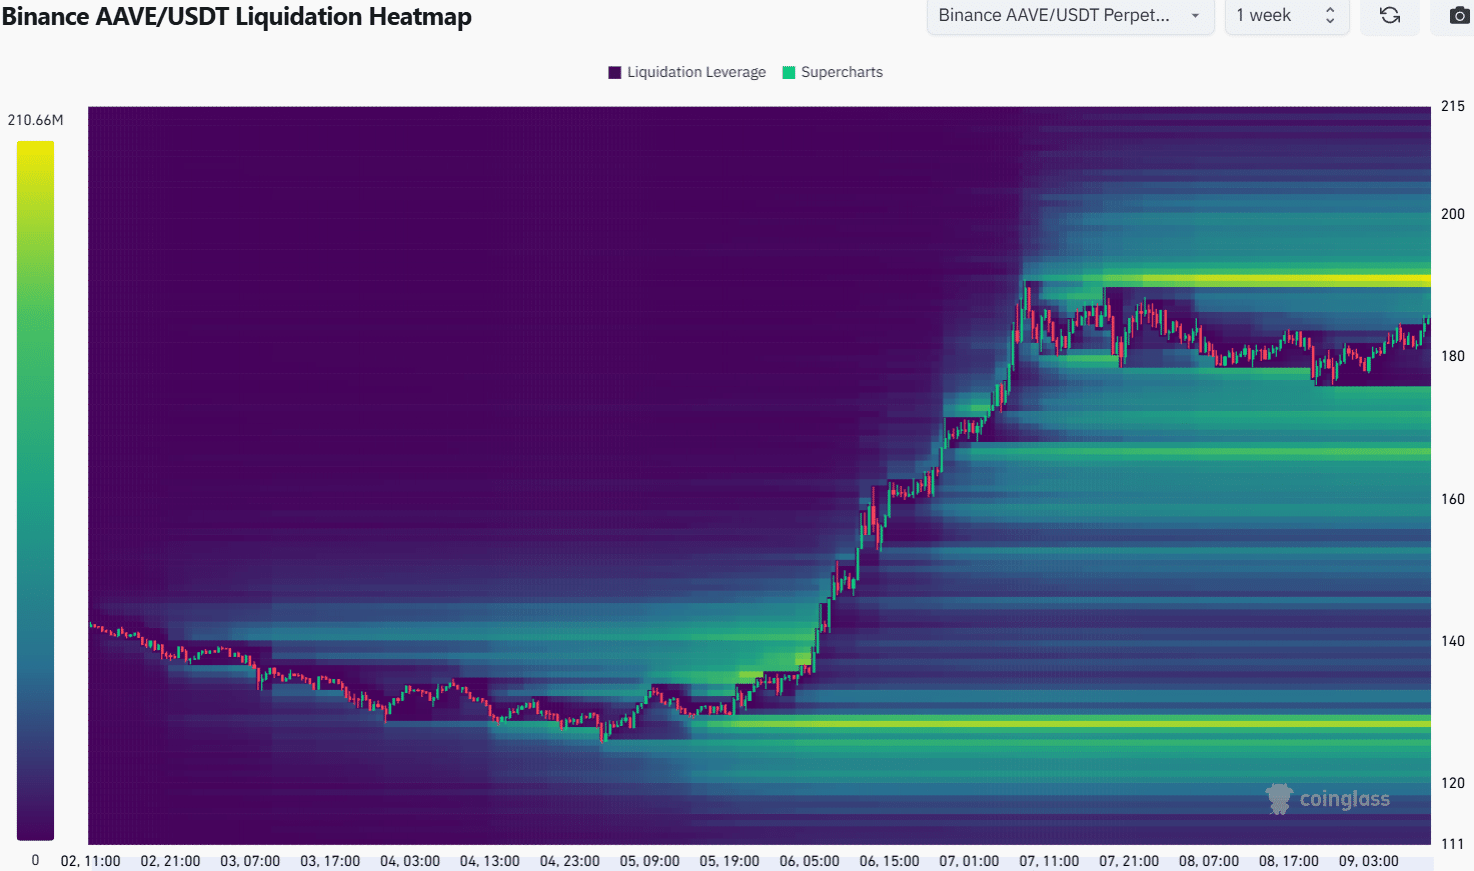
The 1-week heatmap revealed that the $190 region has collected a considerable amount of short liquidation levels over the past two days. This area is likely to be visited soon. It is possible that the $171-$175 zone is also revisited.
Read Aave’s [AAVE] Price Prediction 2024-25
Buyers should expect further gains, but the short-term liquidity pools around $190 and $170 could induce volatility before a move past $200 materializes after the weekend.
Disclaimer: The information presented does not constitute financial, investment, trading, or other types of advice and is solely the writer’s opinion


