Aave hits 100% extension target – Where would the price go

Disclaimer: The findings of the following analysis are the sole opinions of the writer and should not be considered investment advice
Aave has been on a Moon mission on the charts since the launch of AAVE V3 in mid-March. The near-term market structure was strongly bullish. The higher timeframes also showed that the breakout past the $200 area was technically important. It appeared likely that Aave would keep this momentum up in the days to come.
AAVE- 1H
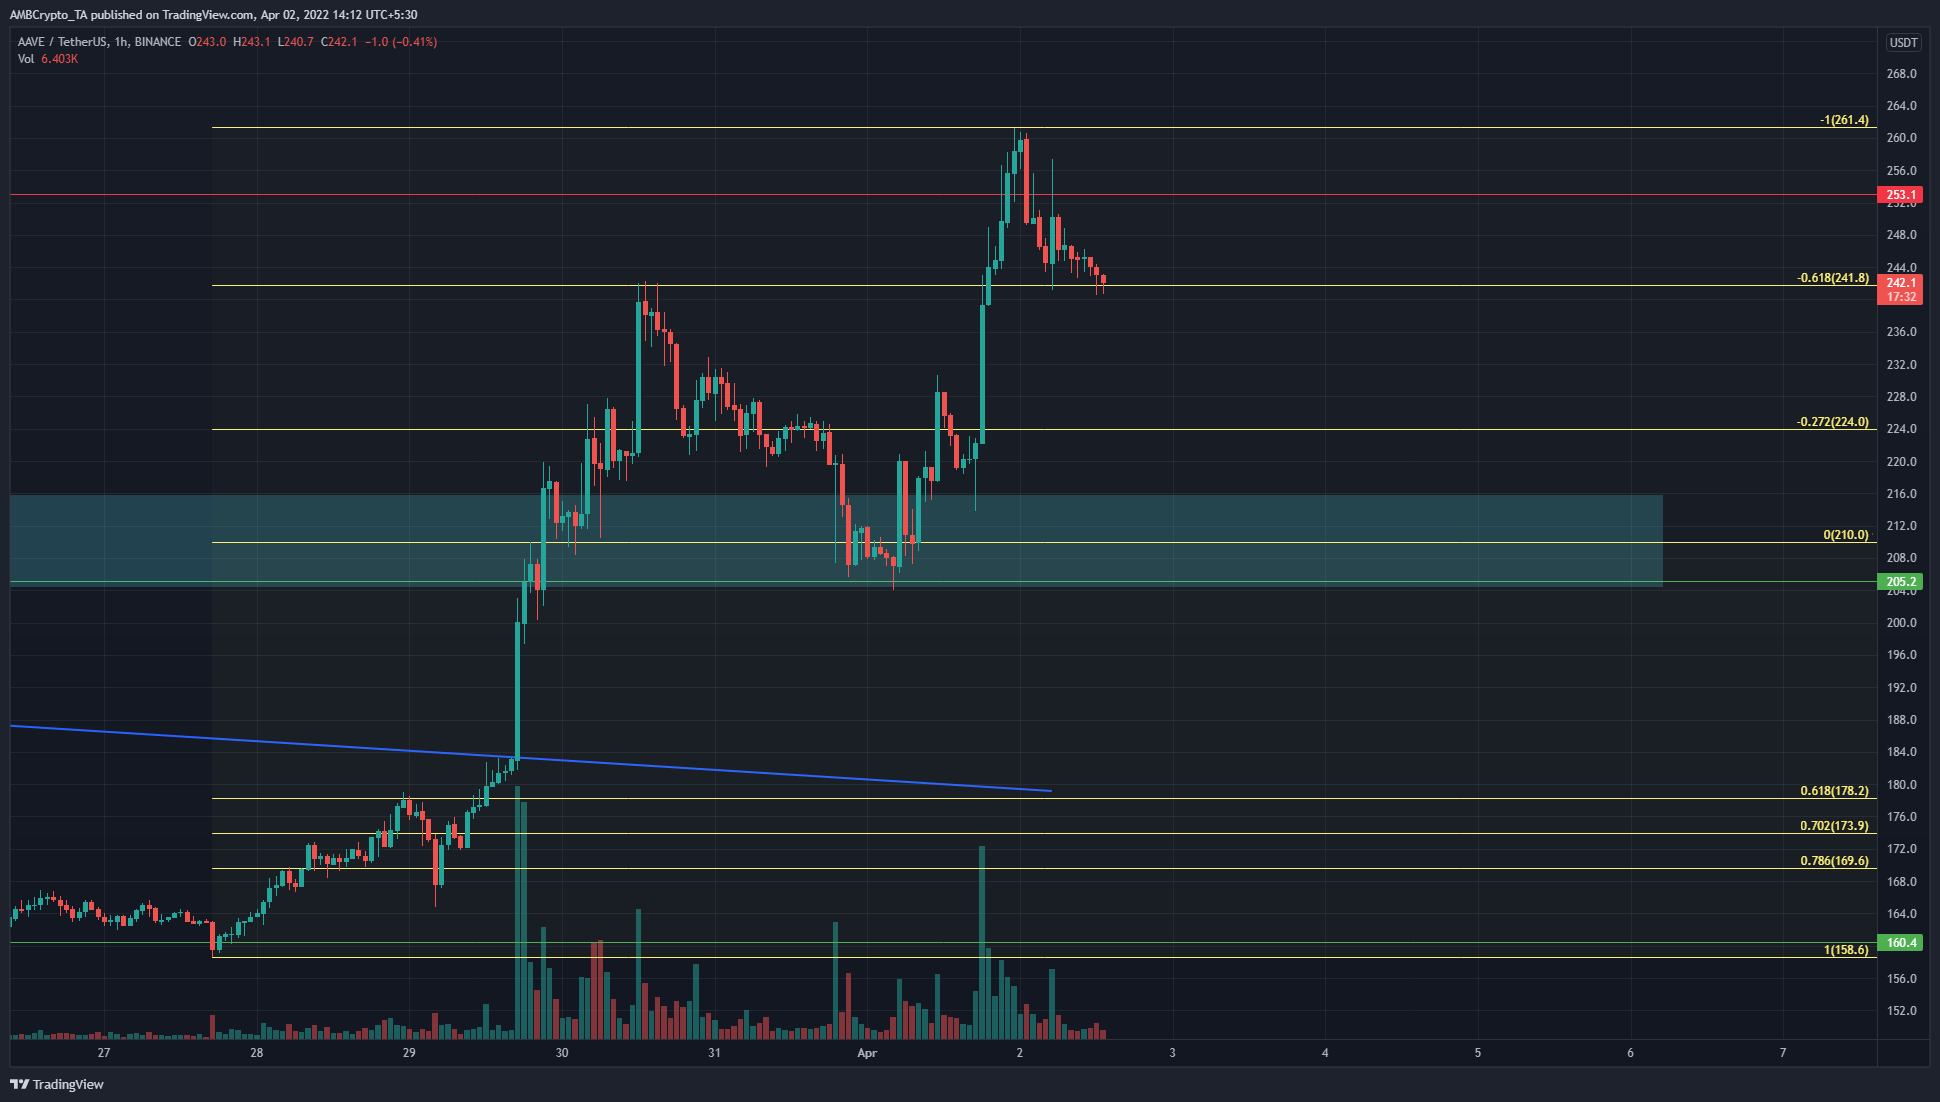
In deep blue is a trendline resistance stretching back to August 2021. In the past few days, this nearly eight-month trendline resistance line had finally been broken. It was a bullish development. Since mid-March, AAVE has had a bullish outlook on the charts, and this development further reinforced bullishness.
Fibonacci retracement and extension levels (yellow) were plotted based on AAVE’s move from $158.6 to $210 and showed the 61.8% and 100% extension levels to lie at $241.8 and $261.4. The price has recently been rejected at the $261 level.
$241, $224 and $210 are places where AAVE could end its retracement and continue moving upward once more.
Rationale
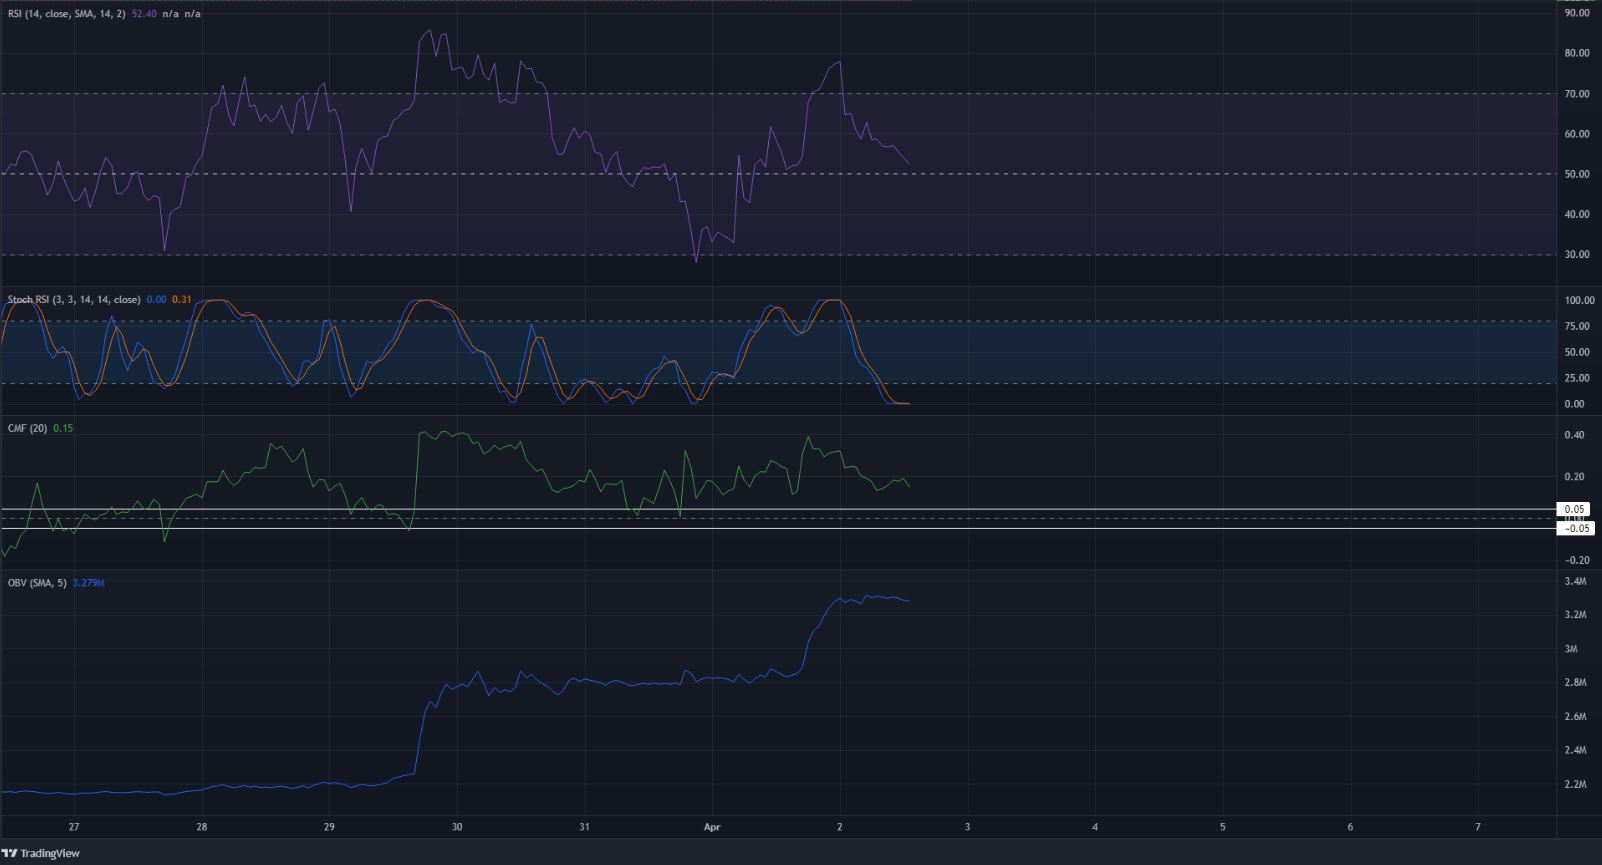
The hourly RSI continued to remain above neutral 50 to show that bullish momentum was still present. The Stochastic RSI descended to oversold territory, and taken together they suggested a bounce could occur at the $241 level.
The CMF was well above the +0.05 mark, while the OBV has also been climbing in the past few days. Hence, we can conclude that strong buying pressure was present at press time.
Conclusion
The momentum and volume indicators gave a positive view of bullish price developments for the next few days. A retracement to $224 or $210 can not be ruled out, but at the time of writing, it appeared like the $240 area could see AAVE bounce higher.
Even in the event of a deeper correction toward $200 for AAVE, the higher timeframe charts suggested that bulls were still in control. The move above $150 and $192 was an important event that tips the balance in favor of the bulls and demarcated the $200 area as a demand zone with buying opportunities. To the north, a breakout past $260 will set the next target of $312 (200% extension) for AAVE.

![Bittensor [TAO]](https://ambcrypto.com/wp-content/uploads/2026/07/Gladys-19-e1784100557377.jpg)