ADA’s break above this level can invalidate Cardano’s bearish propensity

Disclaimer: The findings of the following analysis are the sole opinions of the writer and should not be considered investment advice.
Cardano’s [ADA] prior month’s recovery gave the alt enough leeway to accommodate the recent market-wide liquidations. The immediate drawdowns have pulled ADA below its EMA ribbons over the last few days.
The buyers have found renewed pressure at the $0.43-$0.45 support range over the past day. Thus, ADA was up by 10.45% in the last 24 hours. At press time, ADA was trading at $0.5148.
ADA 4-hour Chart
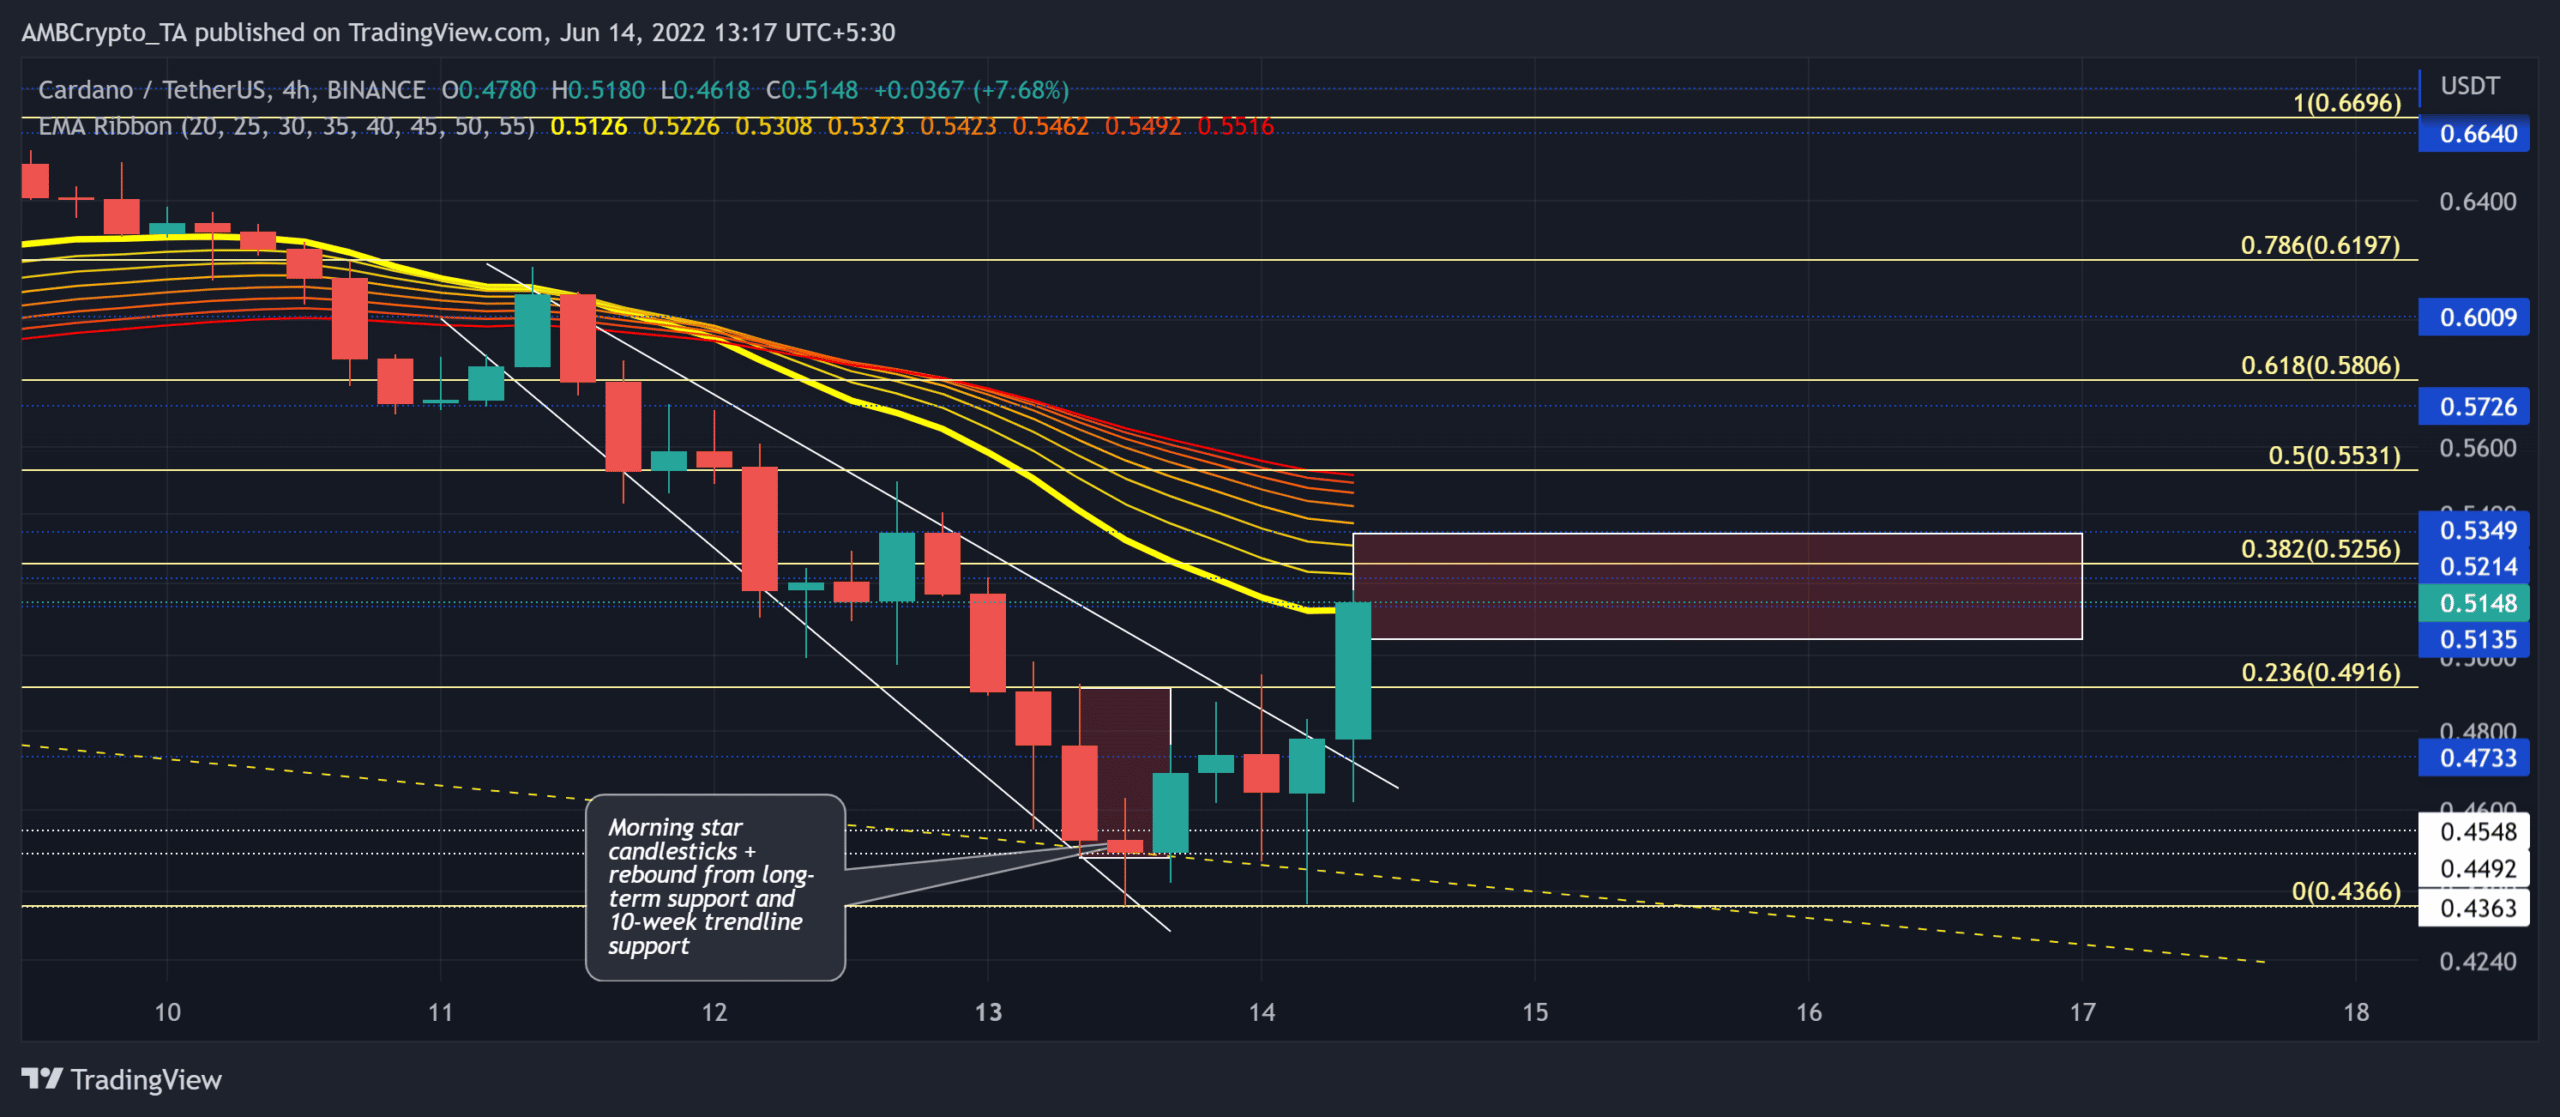
The altcoin’s previous bull rally traversed with the support of its EMA ribbons. ADA registered a nearly 47% ROI (from 29 May low to 8 June high).
With the $0.66-level constricting bullish rallies for over a month, and expected reversal from this level inflicted a 35% drop toward ADA’s monthly low on 13 June.
Post a morning star candlestick structure, the buyers propelled an uptick in the 24-hour buying volumes by over 57% at press time. As a result, over the last few hours, the alt broke out of its descending broadening wedge setup on the 4-hour timeframe.
Also, the 10-week trendline support (yellow, dashed) alongside the Point of Control (POC, red) opened doorways for a bullish counter.
While the broader trend was still under bearish control, ADA could face a barrier in the $0.5-$0.53 range. A strong selling move from this range can pull ADA to retest the $0.48-zone.
In case of a near-term bearish invalidation, the 55 EMA and the 50% Fibonacci in the $0.55-$0.57 range could curb the buying pressure.
Rationale
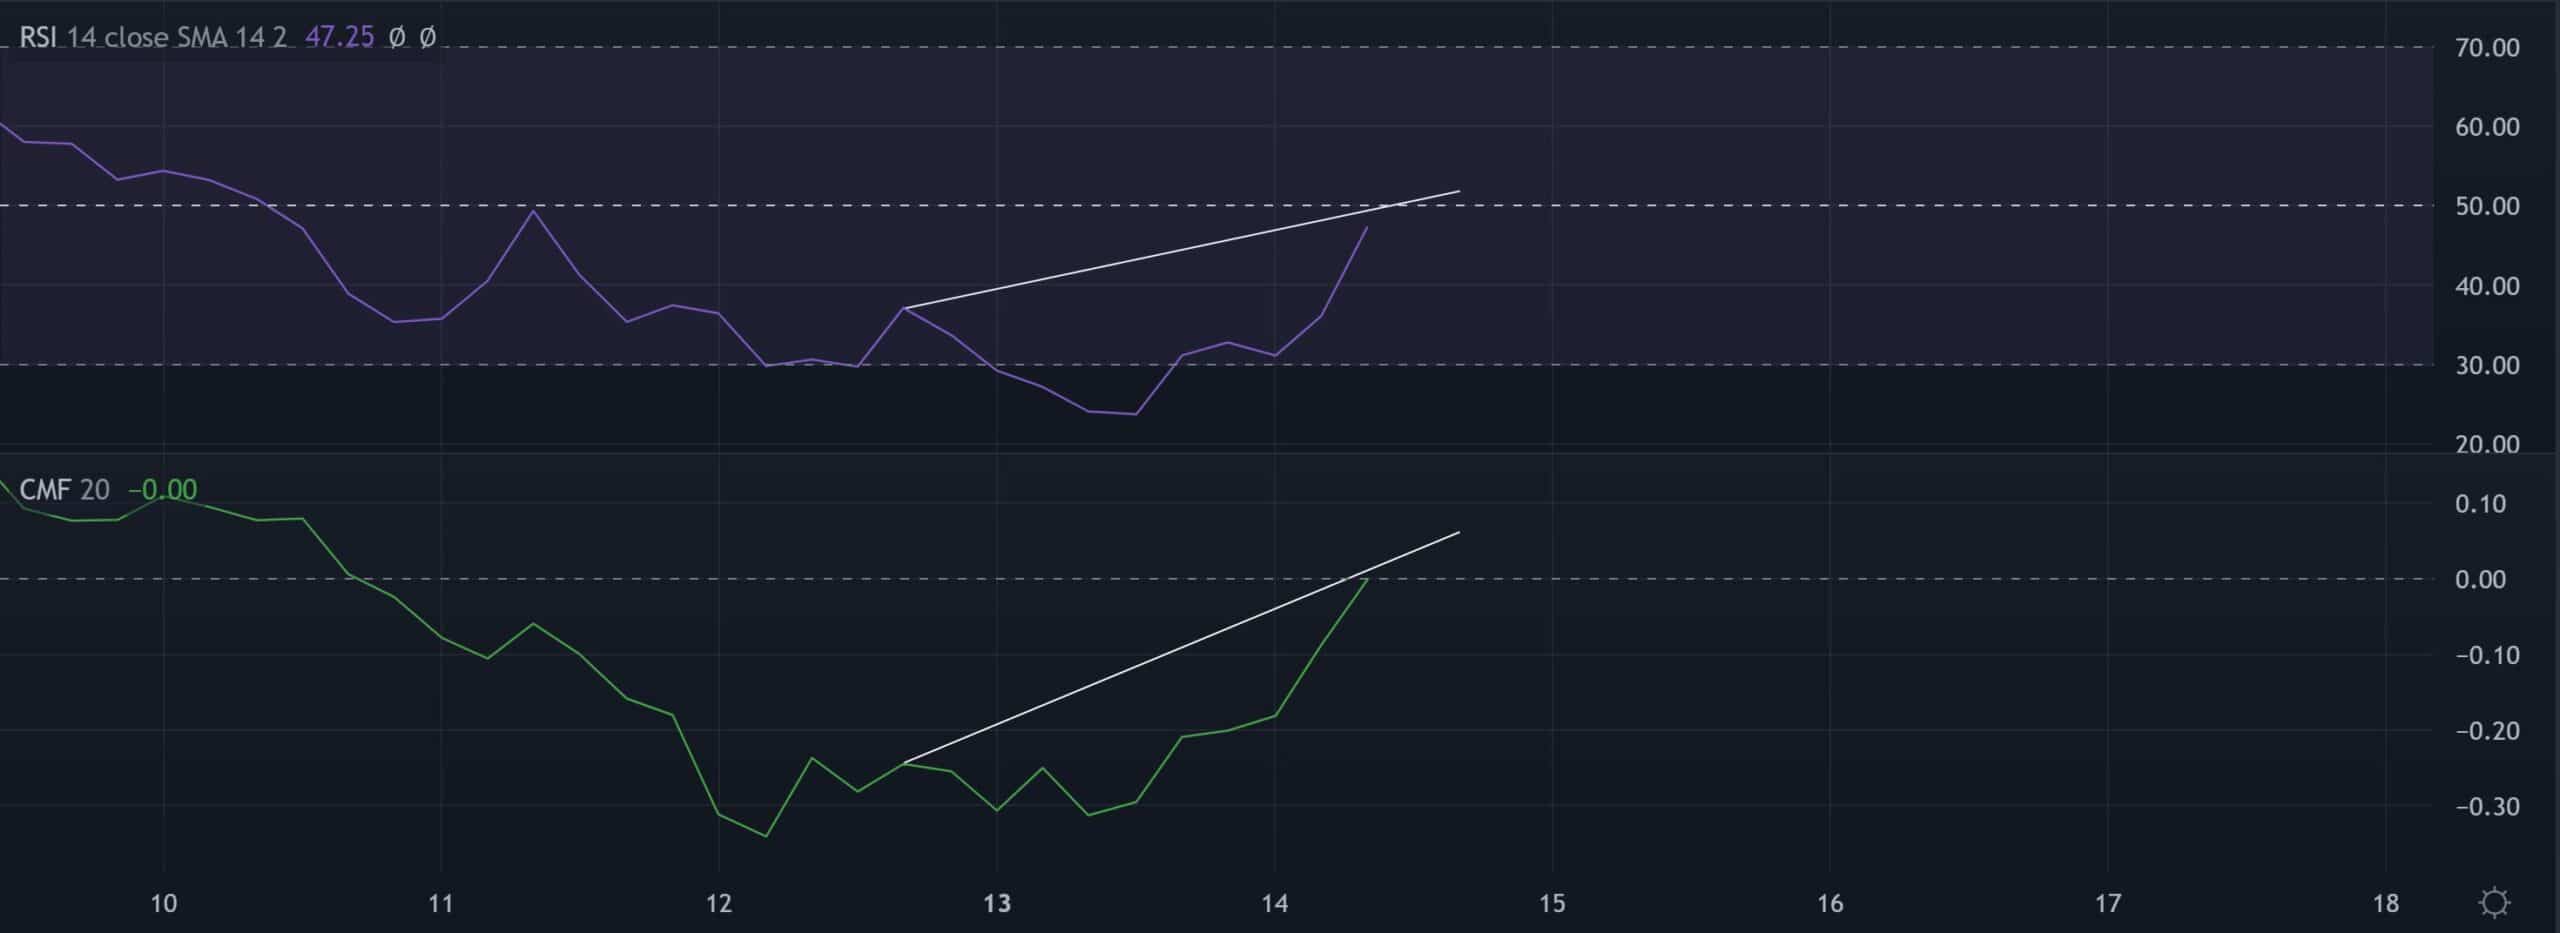
The Relative Strength Index (RSI) took a relatively neutral stance while aiming to test its equilibrium. Its recent growth has marked higher peaks against the lower peaks of the price. Thus, any reversal from the midline could affirm a bearish divergence.
Similarly, a slowdown or a reversal from the zero-mark of the CMF could confirm a bearish divergence with the price.
Conclusion
Trading against the current trend may not be profitable, especially with the potential threat of bearish divergences on the RSI and CMF. Any reversal from the immediate supply zone can inflict a drawdown toward the $0.47-zone.
A bearish invalidation can pave a short-term recovery toward the $0.55-level before the sellers try to step in.
At last, traders/investors should keep a close watch on Bitcoin’s movement and its effects on the wider market to make a profitable move.


