Algorand, Ethereum Classic, Axie Infinity Price Analysis: 02 March

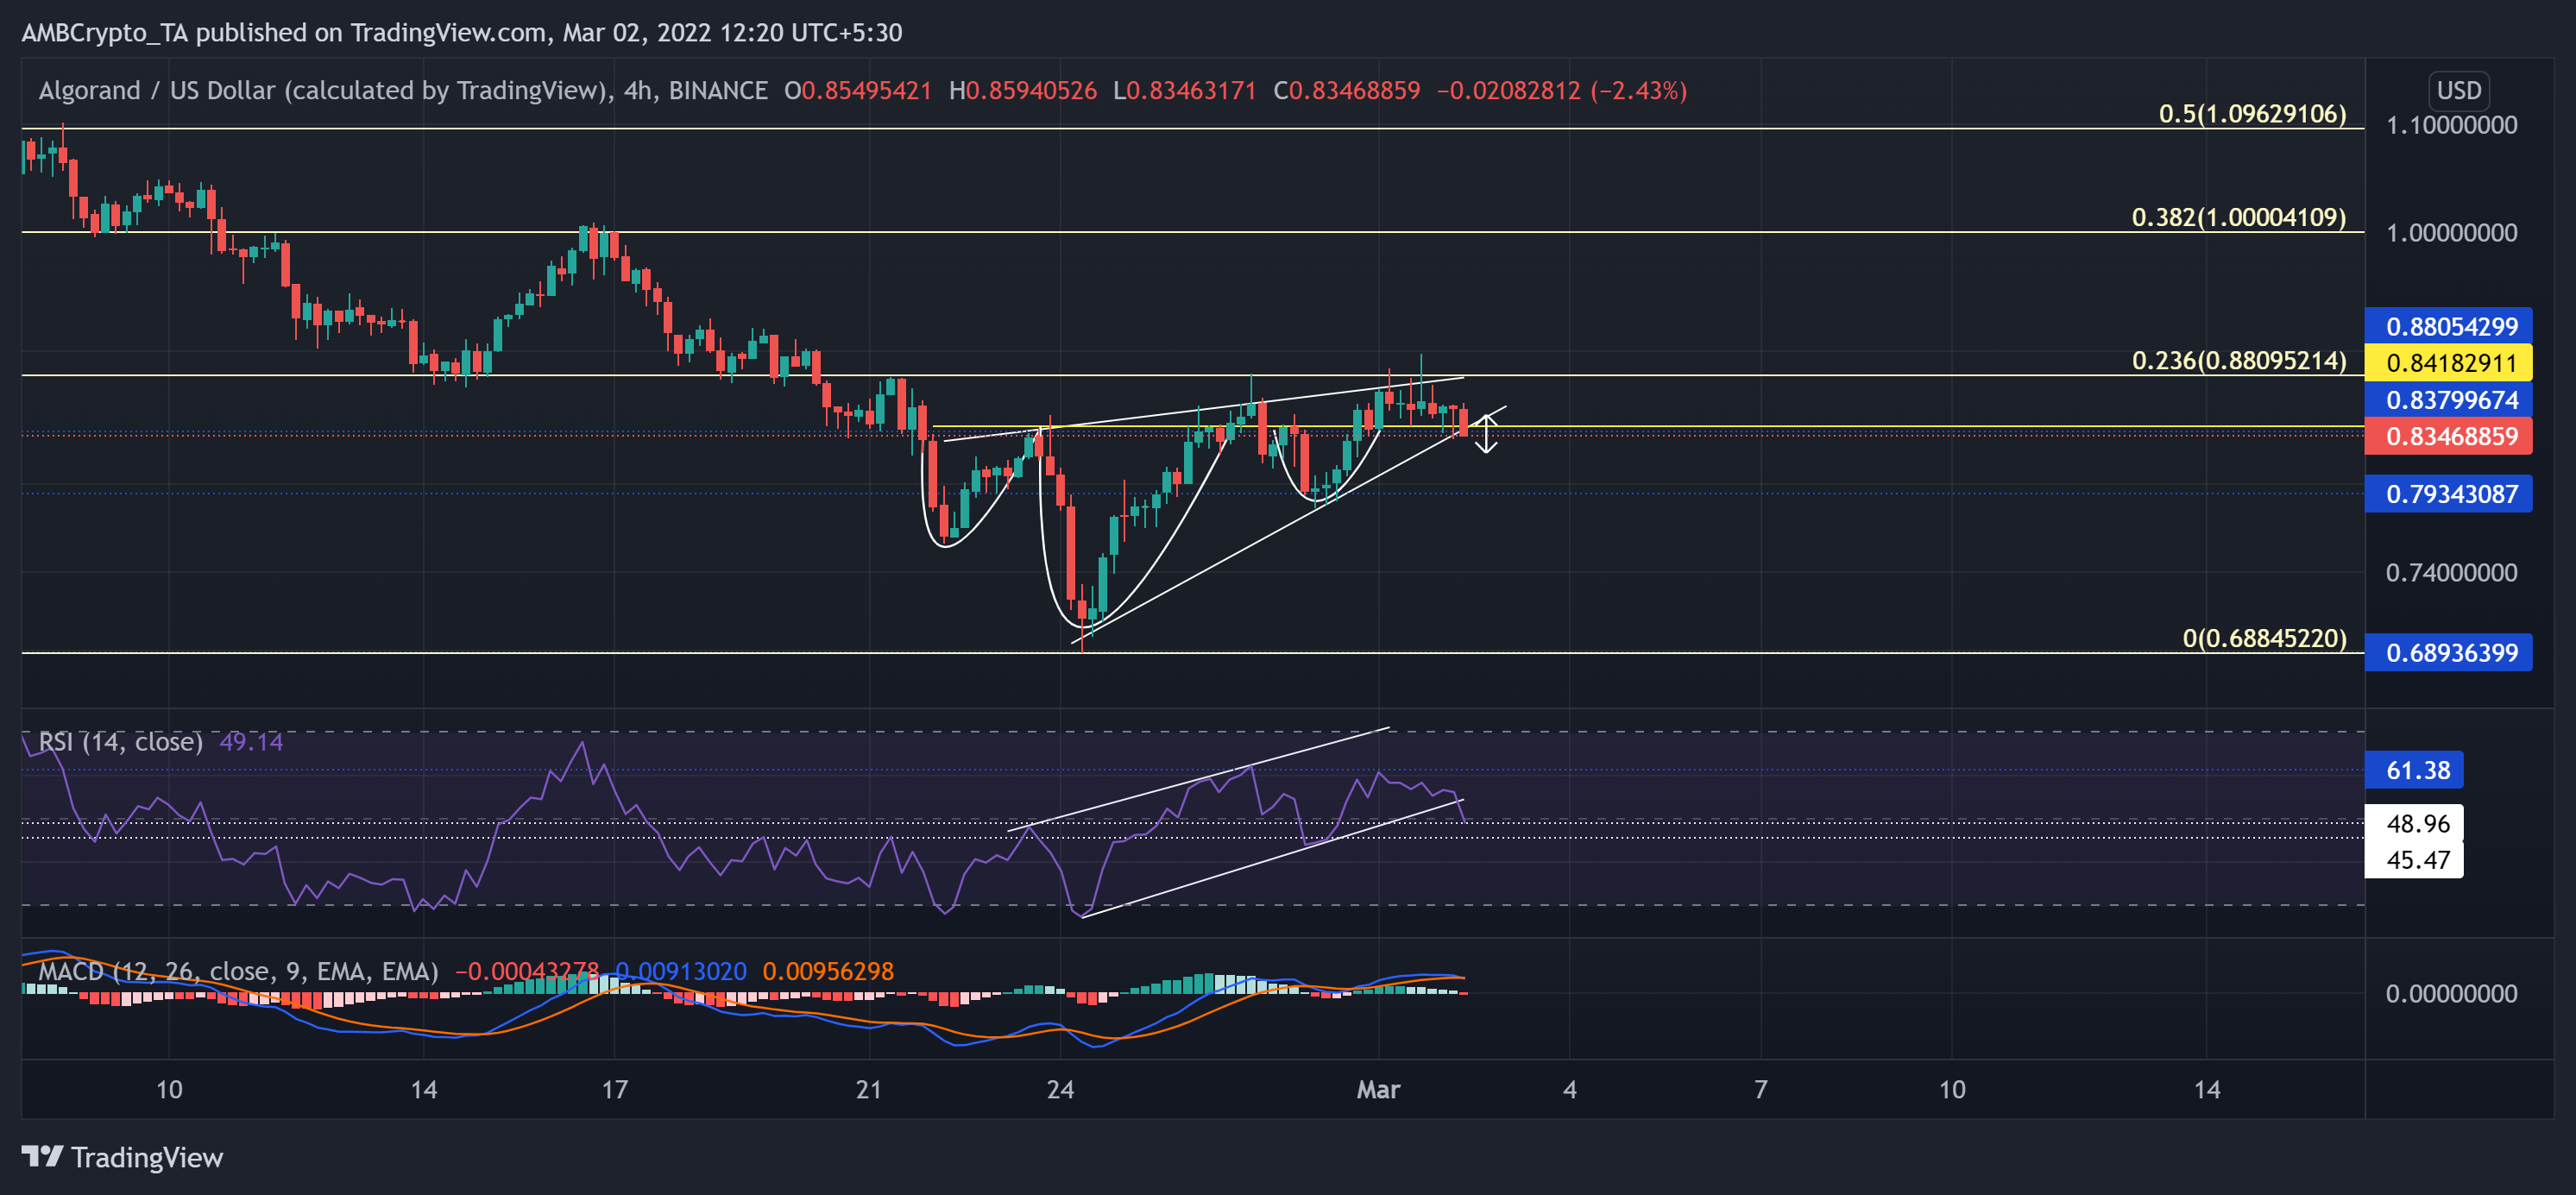
Although Algorand saw impressive gains from its February lows, it walked on thin ice. A sustained close below its pattern could brace the alt for a $0.79 retest.
Further, Ethereum Classic witnessed a bullish flip on its EMA ribbons. Their bulls now had to defend the 20 EMA to prevent a fallout. Also, Axie Infinity managed to rise above its SMAs while its RSI reversed from the overbought mark.
Algorand (ALGO)
After struggling to topple the $1.8-resistance, the bulls lost their thrust after the heightened sell-offs over the last two months. Thus, the alt lost nearly 61.5% of its value (from 5 January) and pulled back towards its seven-month low on 24 February.
Since then, ALGO buyers have made promising recovery efforts in the last week. As a result, the alt was up by 27% from the $0.68-support. Meanwhile, the 23.6% Fibonacci resistance still stood sturdy.
At press time, ALGO traded at $0.8347. The RSI witnessed an up-channel breakdown in the last few hours. This break should find range support near the 45-47 point before a committal move. Looking at the MACD, it becomes evident that the bullish momentum is taking a back seat.
Ethereum Classic (ETC)
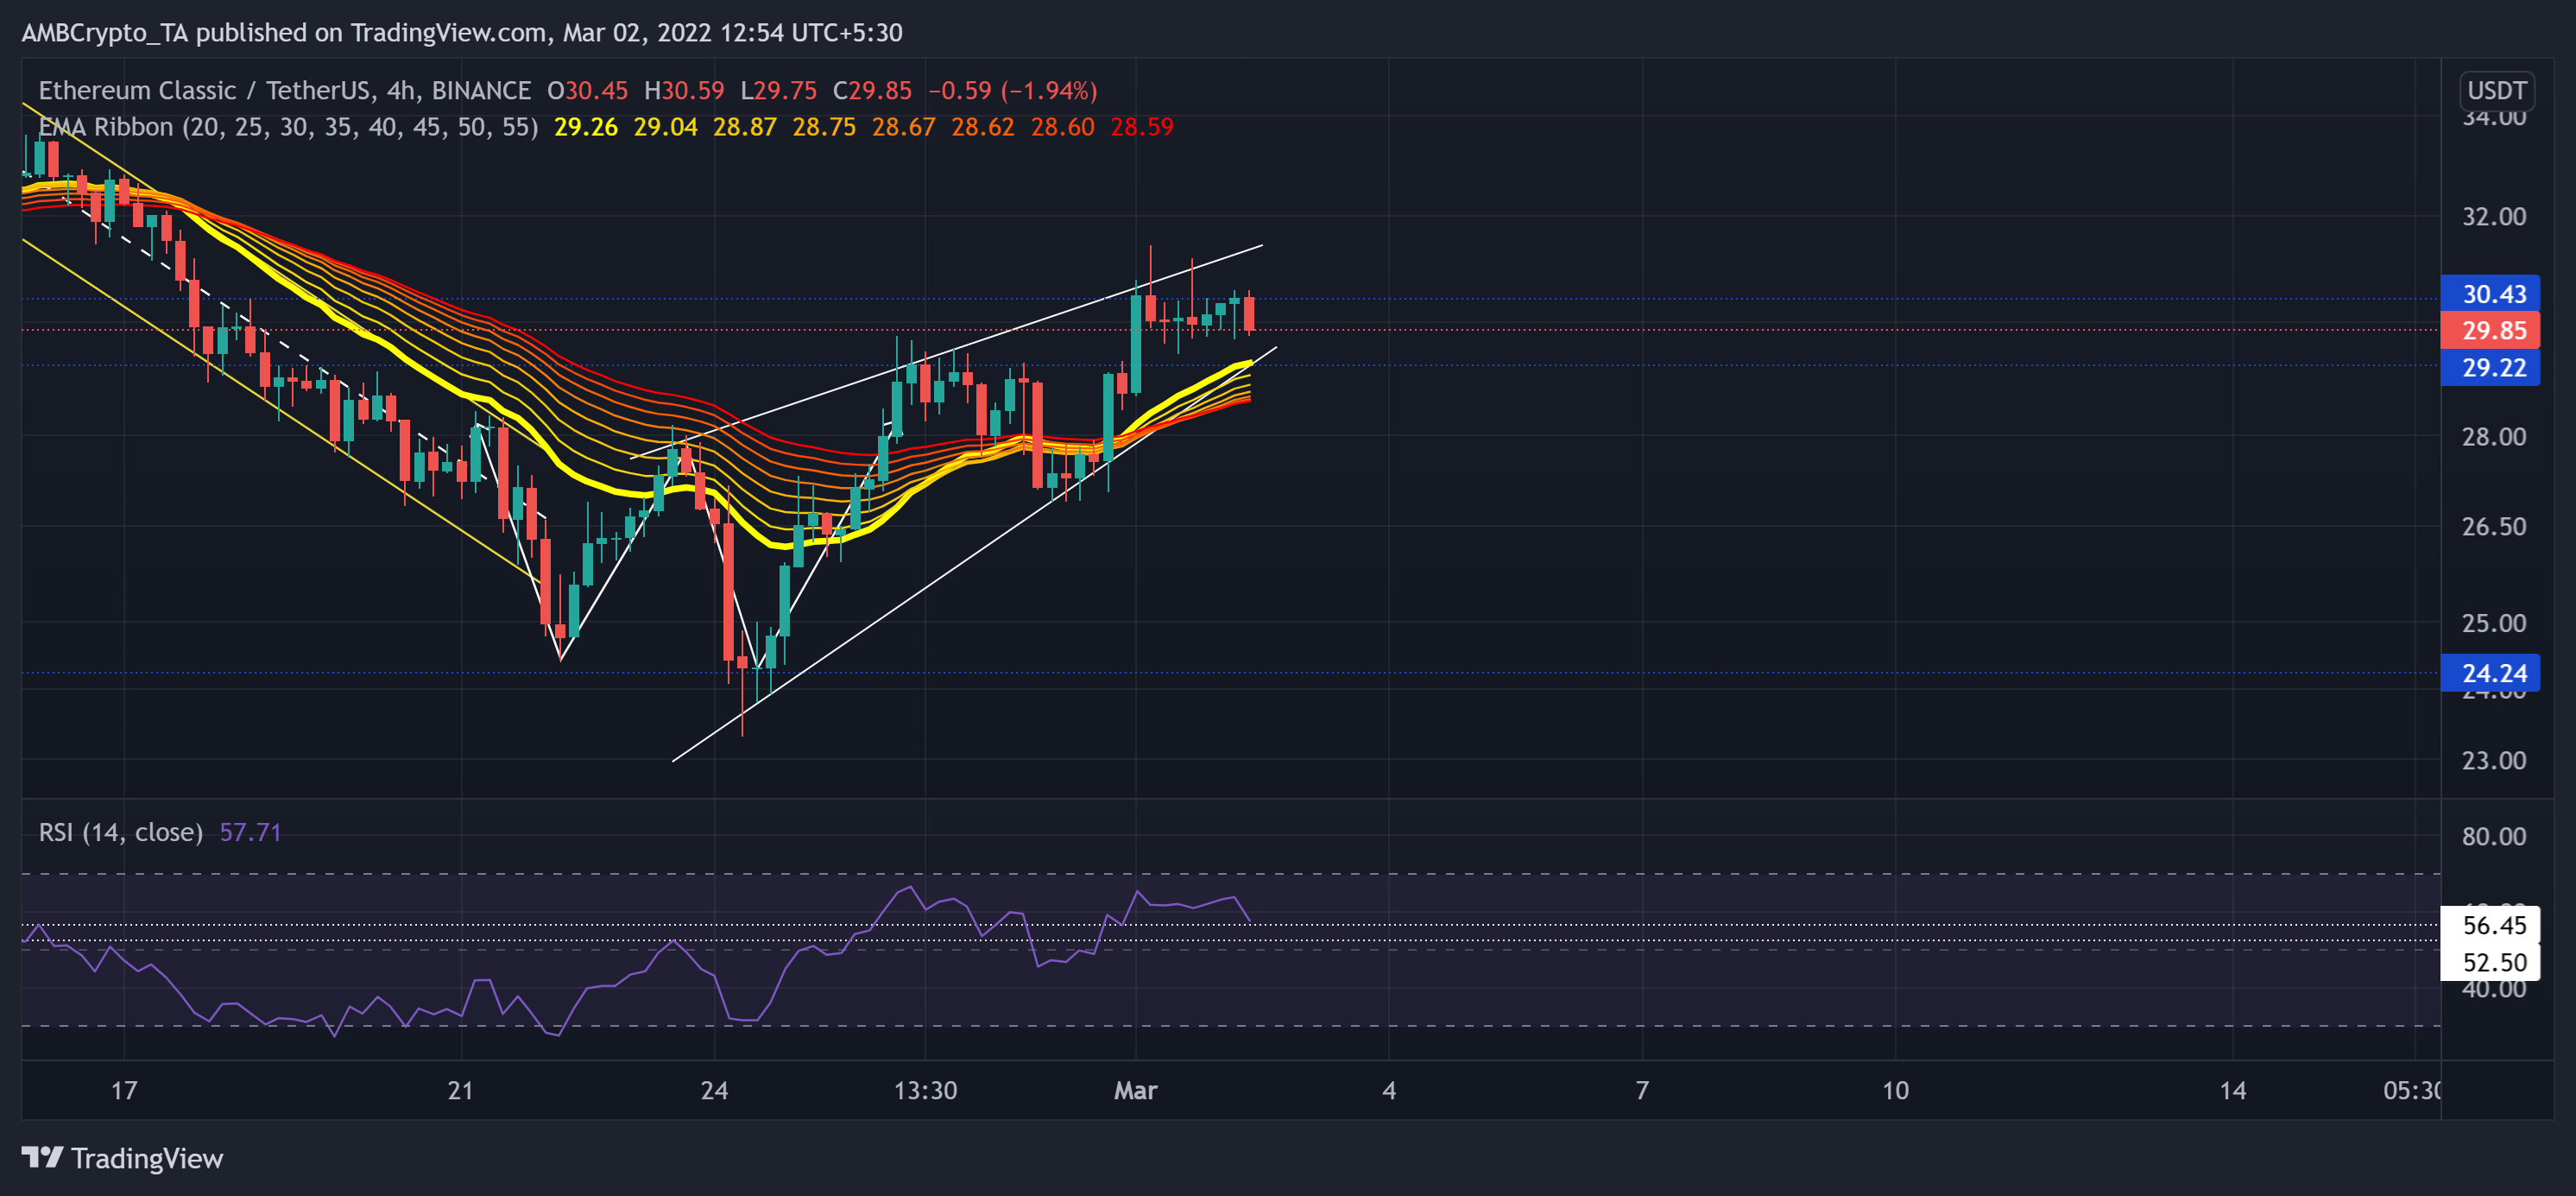
After picking itself up from the $21-mark of its January lows, ETC has managed to find a traversing range in the $24-$30 zone for the past two weeks. After recently testing its floor, the alt has been steeply upturned in a rising wedge (white) on its 4-hour chart.
Consequently, the bulls finally flipped the EMA Ribbons in their favor after a nearly 28% ROI in just the last six days. From here on, the 20 EMA would be a vital support for the buyers to defend for preventing a patterned breakout.
At press time, ETC was trading at $29.85. The RSI exhibited a bullish inclination after a week-long recovery. Now, it aimed to test the 52-56 range before a possible revival in the near term.
Axie infinity (AXS)
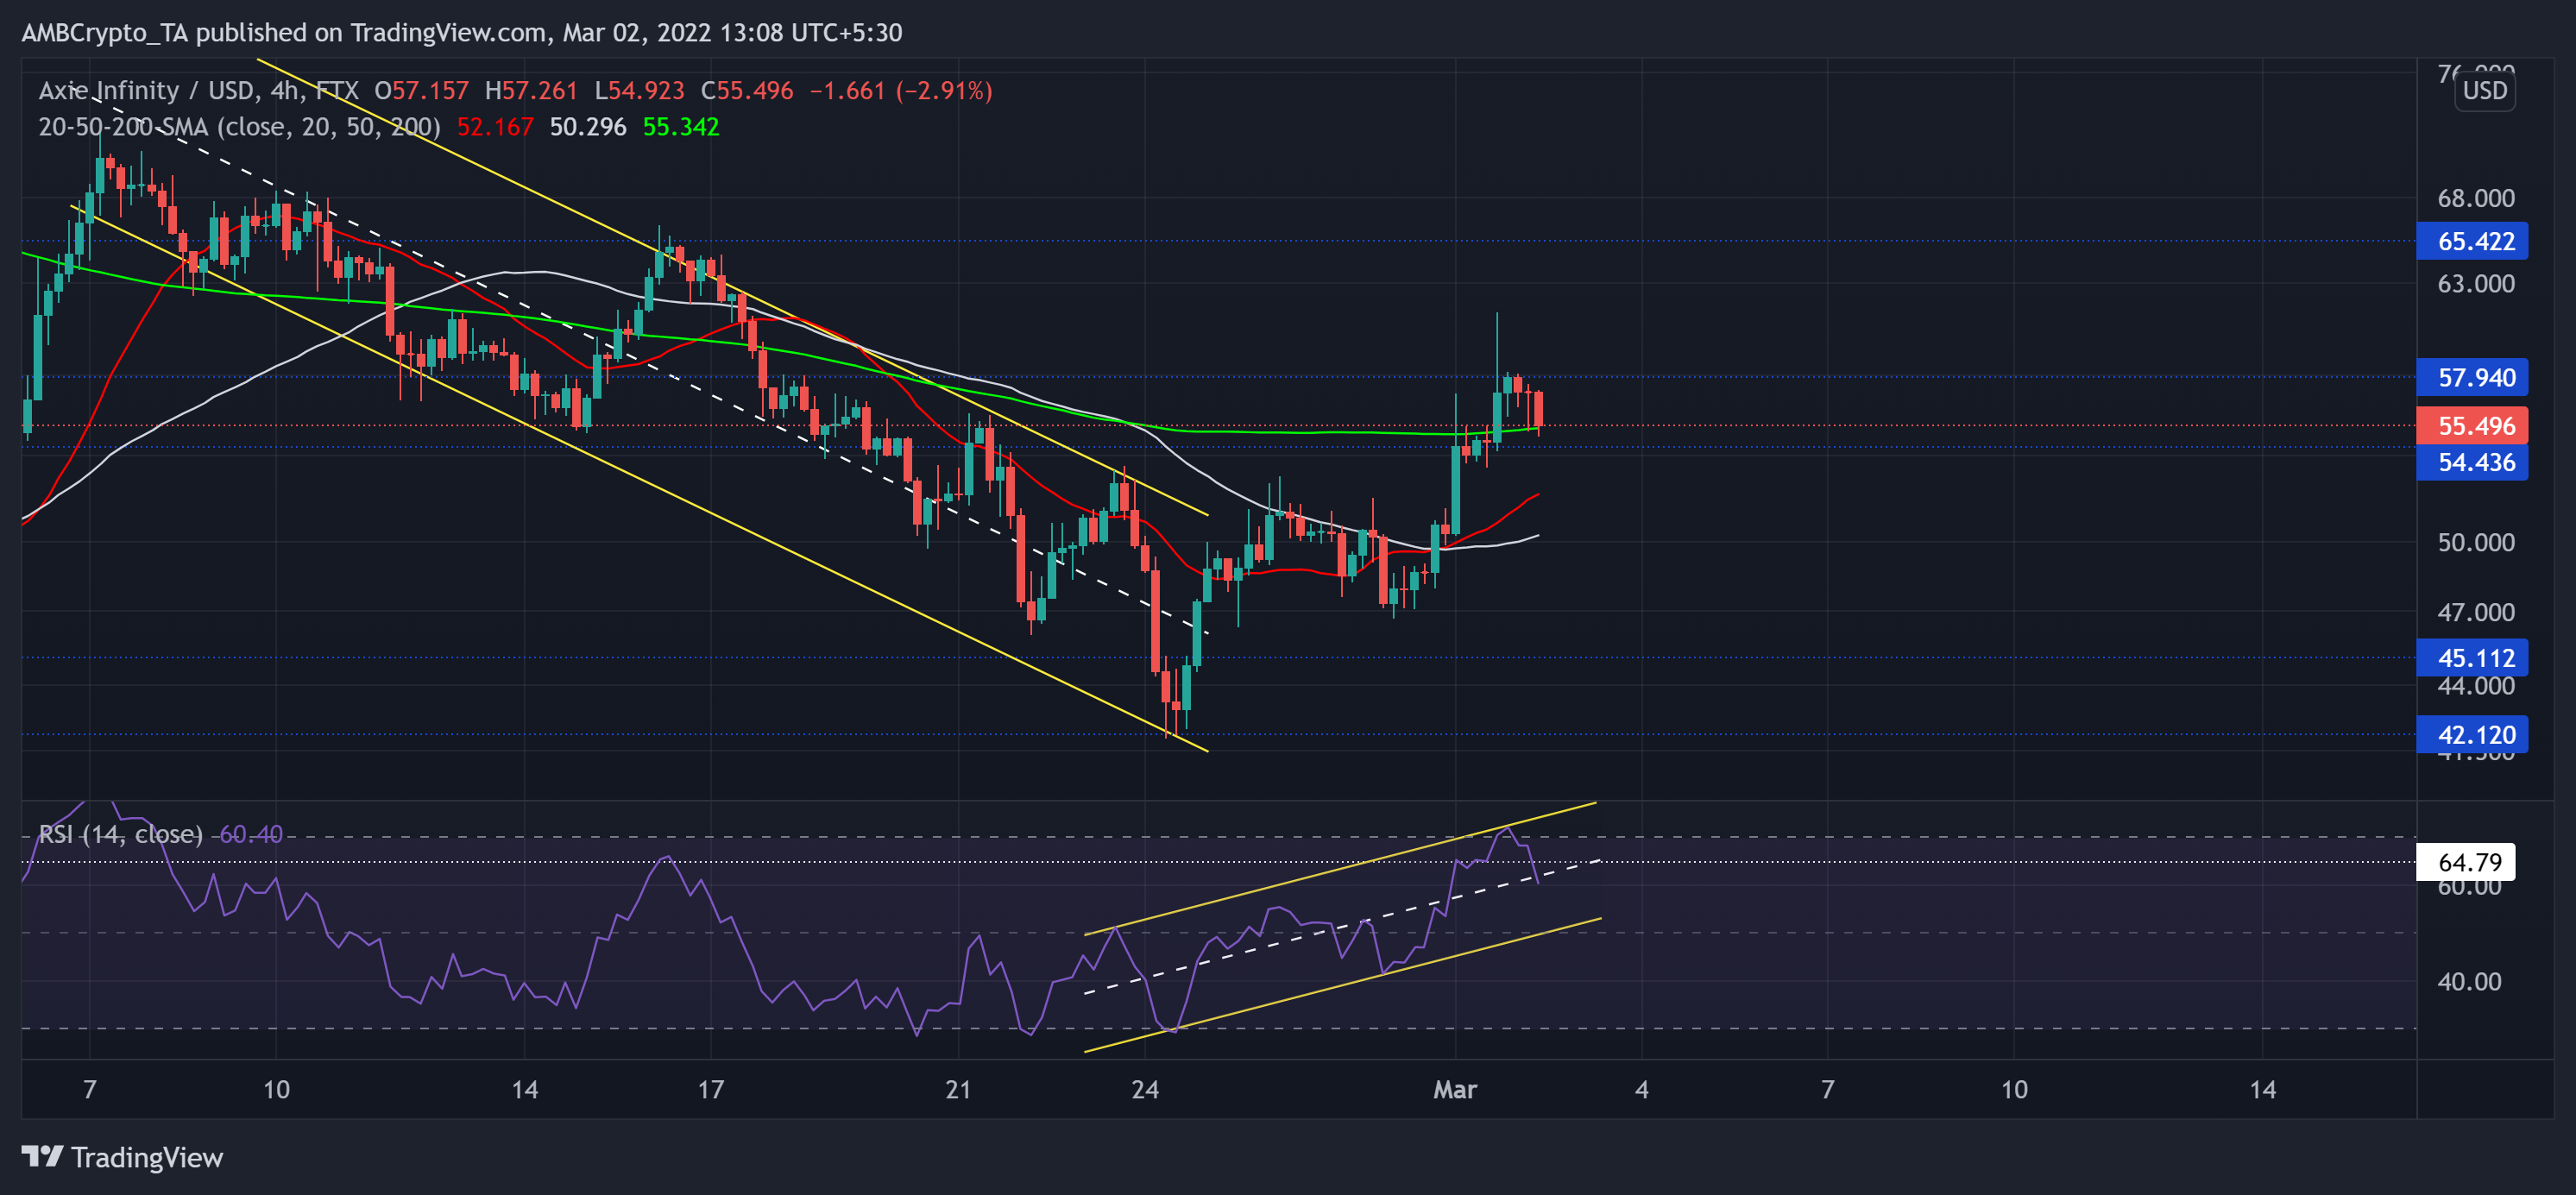
As the bears took over from the $65-level, AXS lost crucial price points in the last 20 days. The alt lost over 40% of its value (since 7 February) as it headed south to touch its six-month low on 24 February.
Due to this, it fell below its 20-50-200 SMA while retesting the $42-support. Since the buyers were keen on keeping this support intact, the alt saw grew by over 30% in the last five days. Thus, rising above its moving averages while the 20 SMA (red) jumped above 50 SMA (grey). From here, any retracements would find support at the $54-level followed by the 20 SMA.
At press time, AXS traded at $55.496. The RSI saw a sharp plunge from the overbought mark and headed towards its equilibrium. Thus, revealing a slightly decreasing bearish vigor.


