Algorand: Here’s how this divergence could play out for ALGO traders

Disclaimer: The findings of the following analysis are the sole opinions of the writer and should not be considered investment advice.
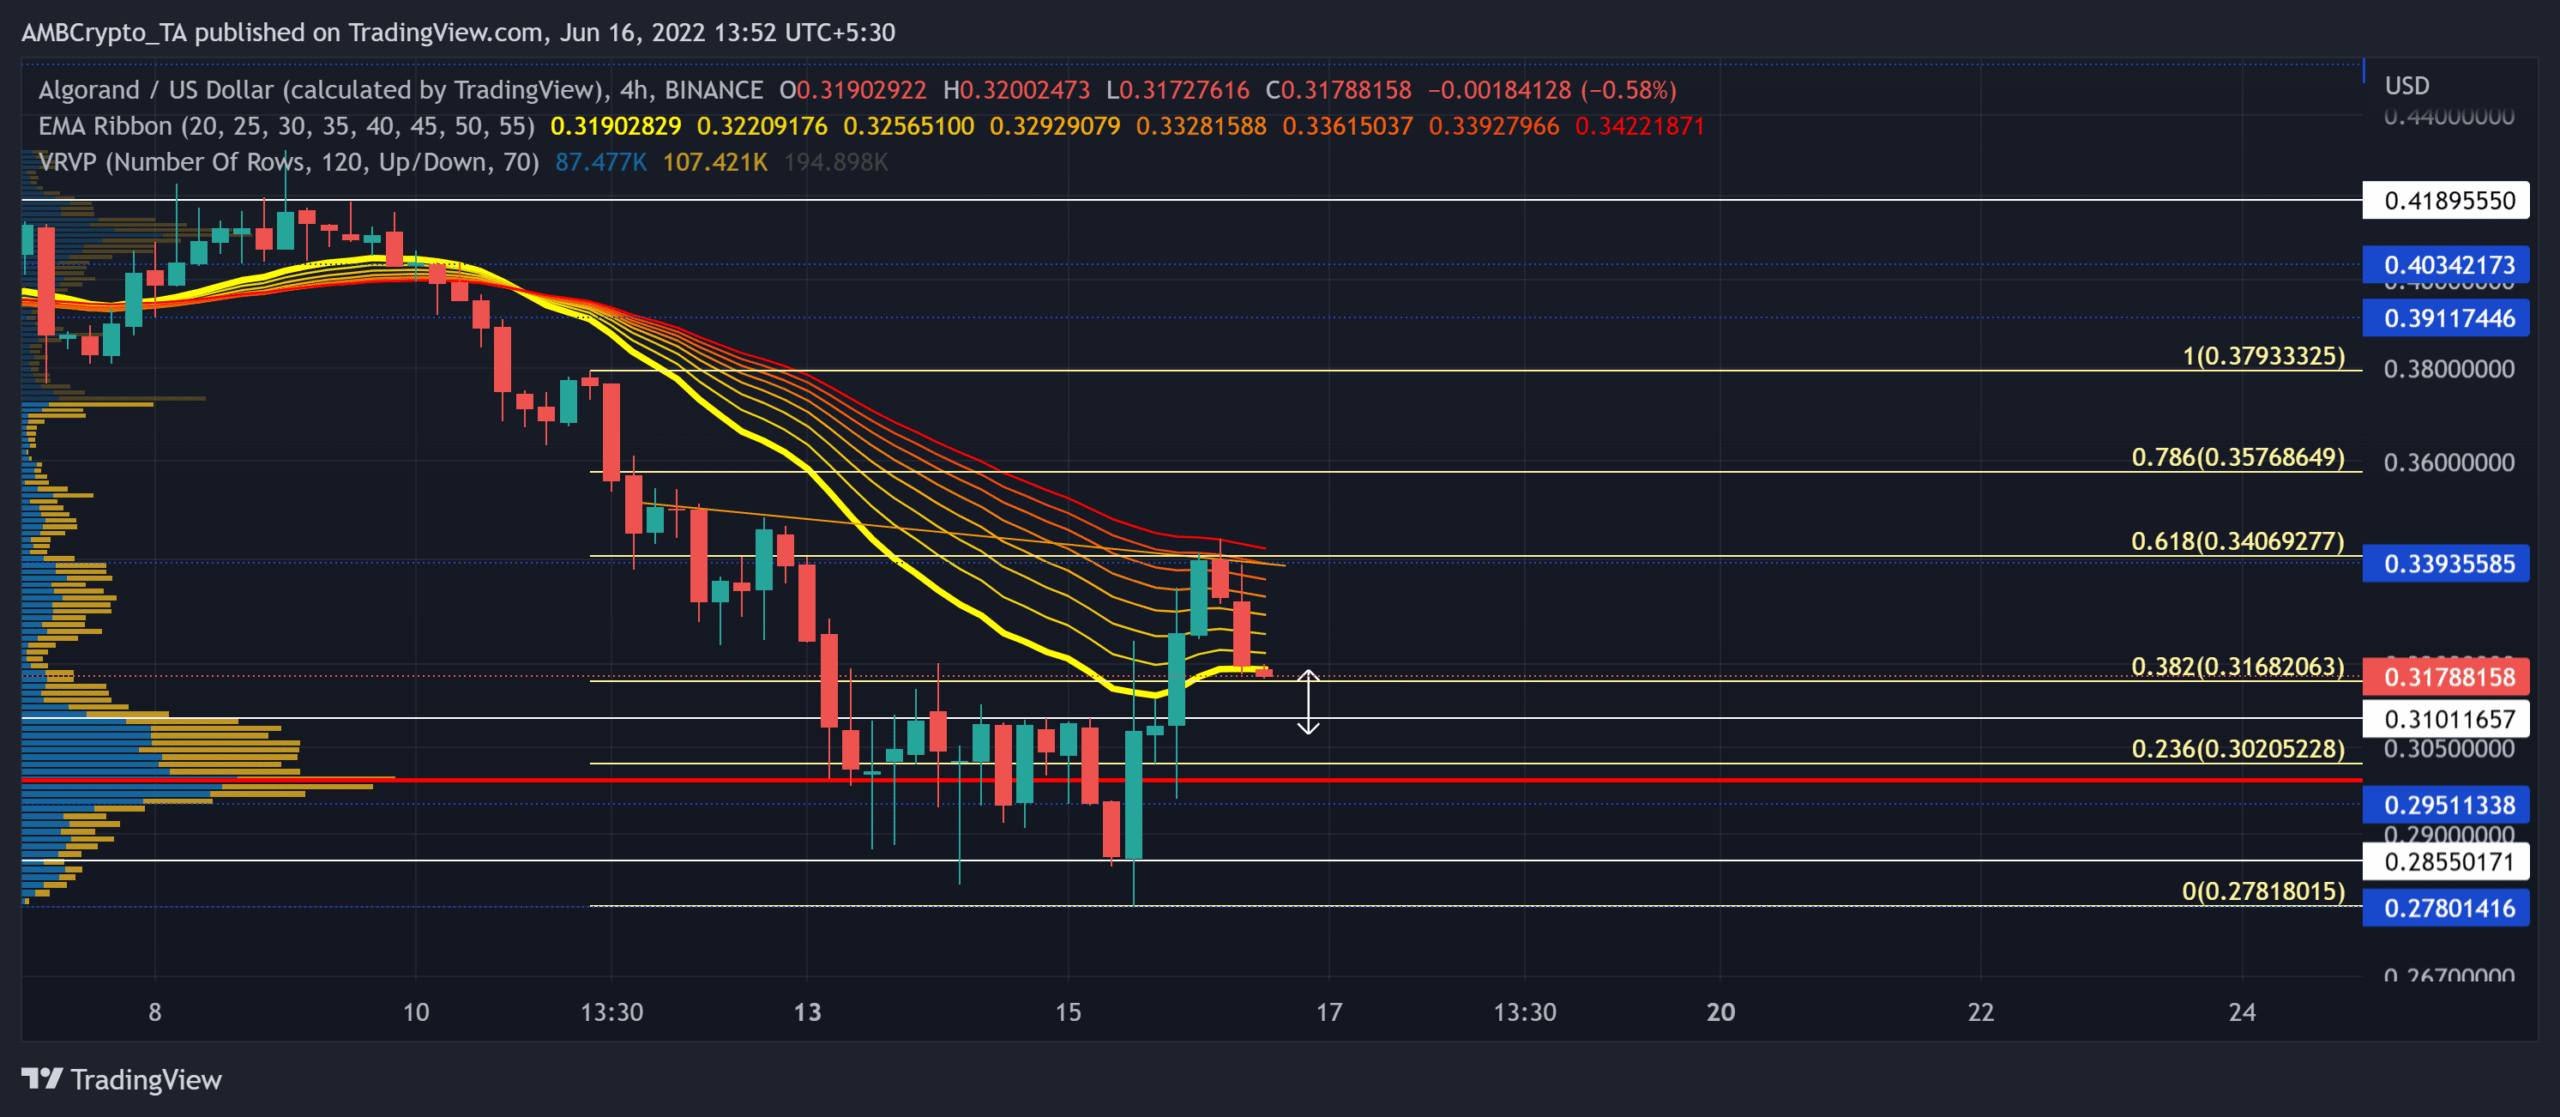
As the buyers built pressure at the $0.41-resistance, the bears quickly reacted by inflicting a steep plummet toward Algorand’s [ALGO] multi-monthly lows. The market-wide drawdowns accelerated the alt’s southbound journey to the $0.29 support.
While the recent recovery slammed into the 61.8% Fibonacci resistance, the resultant rebound can slow down ALGO’s near-term recovery prospects. At press time, ALGO traded at $0.31788, up by 13.04% in the last 24 hours.
ALGO 4-hour Chart
After the buyers lost their edge at the $0.41-resistance, ALGO saw a string of red candles after a bearish engulfing candlestick. The alt lost over a third of its value in just six days (9-15 June) and poked its 16-month low on 15 June.
The recent bullish engulfing candlestick negated the selling pressure by provoking double-digit 24-hour gains. But the 61.8% Fibonacci resistance coincided with the 55 EMA and created a stiff barrier for the buyers.
ALGO also registered an over 65% uptick in trading volumes alongside the recent gains. This reading depicted a robust buying move but the broader trend still favored the sellers.
The traders/investors must watch out for a close below the 20 EMA and the $0.3101-support. A fall below this level could lead ALGO toward its Point of Control (POC, red) in the $0.29-zone. Any bounce-back from the ribbons could propel an extended squeeze phase.
Rationale
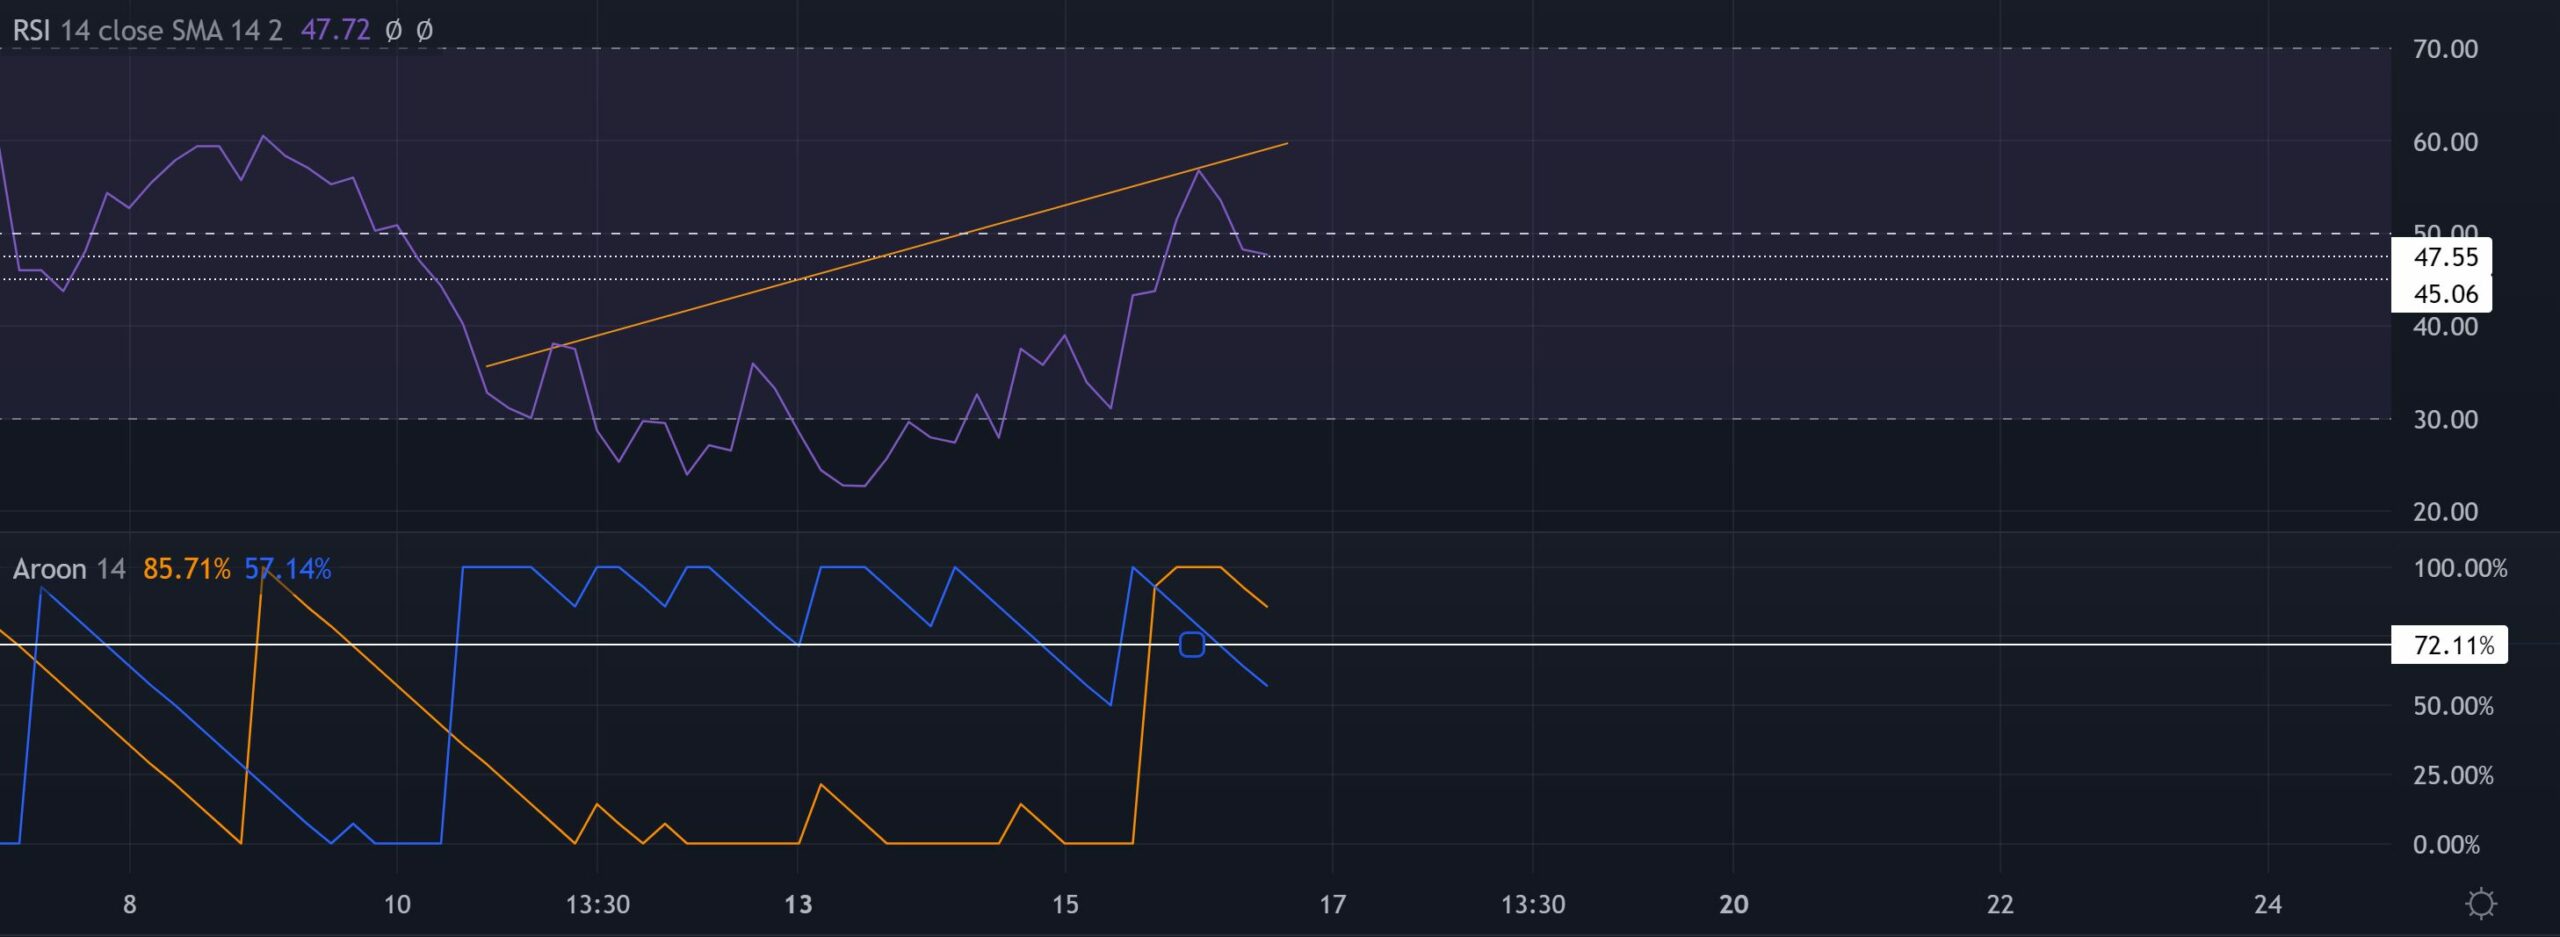
Over the last five days, the RSI marked higher peaks whilst jumping above the equilibrium. But the resultant bearish divergence with the price pulled the index below the mid-line. A fall below the 47-45 range would affirm the chances of a near-term slowdown on the chart.
Aroon Up’s (yellow) recent trajectory exhibited a buying inclination. Its close below the 70% mark could hamper the recovery chances.
Conclusion
The confluence of the 61.8% level, 55 EMA, and the RSI bearish divergence could inflict an extended decline. Any close below the $0.31-zone could expose the alt to a 6-7% downside toward the POC before any trend-altering move.
A bounce back from the 20 EMA could help the buyers retest the 61.8% level in the coming sessions.
Finally, the investors/traders should keep a close watch on Bitcoin’s movements as ALGO shares a 72% 30-day correlation with the king coin.


