How The Graph’s [GRT] short-term woes can pave way for a better long-term rally

The Graph token is arguably one of the crypto projects that have a bright future thanks to its strong fundamentals and unique focus. However, GRT’s price action has been crashing in tandem with the rest of the crypto market, thus failing reflect the network’s growth.
Some of the top blockchain networks have already adopted The Graph’s blockchain indexing services. The network recently went a step further by completing integration with the Cosmos hub. This is considered one of the most crucial developments because it will allow more blockchains to easily access The Graph’s services. GRT’s demand and utility are subsequently expected to increase.
Is GRT still at risk of more downside?
GRT exited the narrow range in the second half of May with extended downside which saw it drop as low as $0.090. The last time that it traded at such price levels was in December 2020. GRT has been trading within a descending wedge pattern underscored by support and resistance. Although its price action has been bearish the last few days, it still has room for more downside before interacting with its support line.
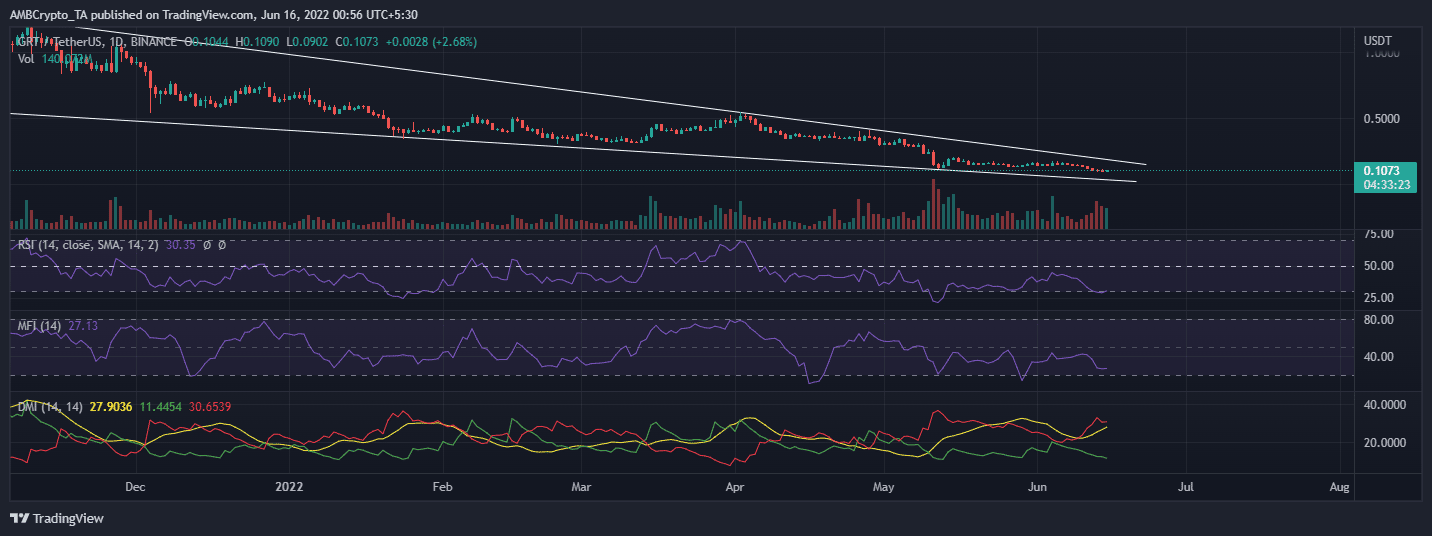
GRT bears appear to be cooling off in the last two days after a heavy assault since 7 June. This is largely because the price dropped into oversold territory according to the RSI. The -DI experienced a slight trend reversal since 13 June, confirming the drop in bearish momentum.
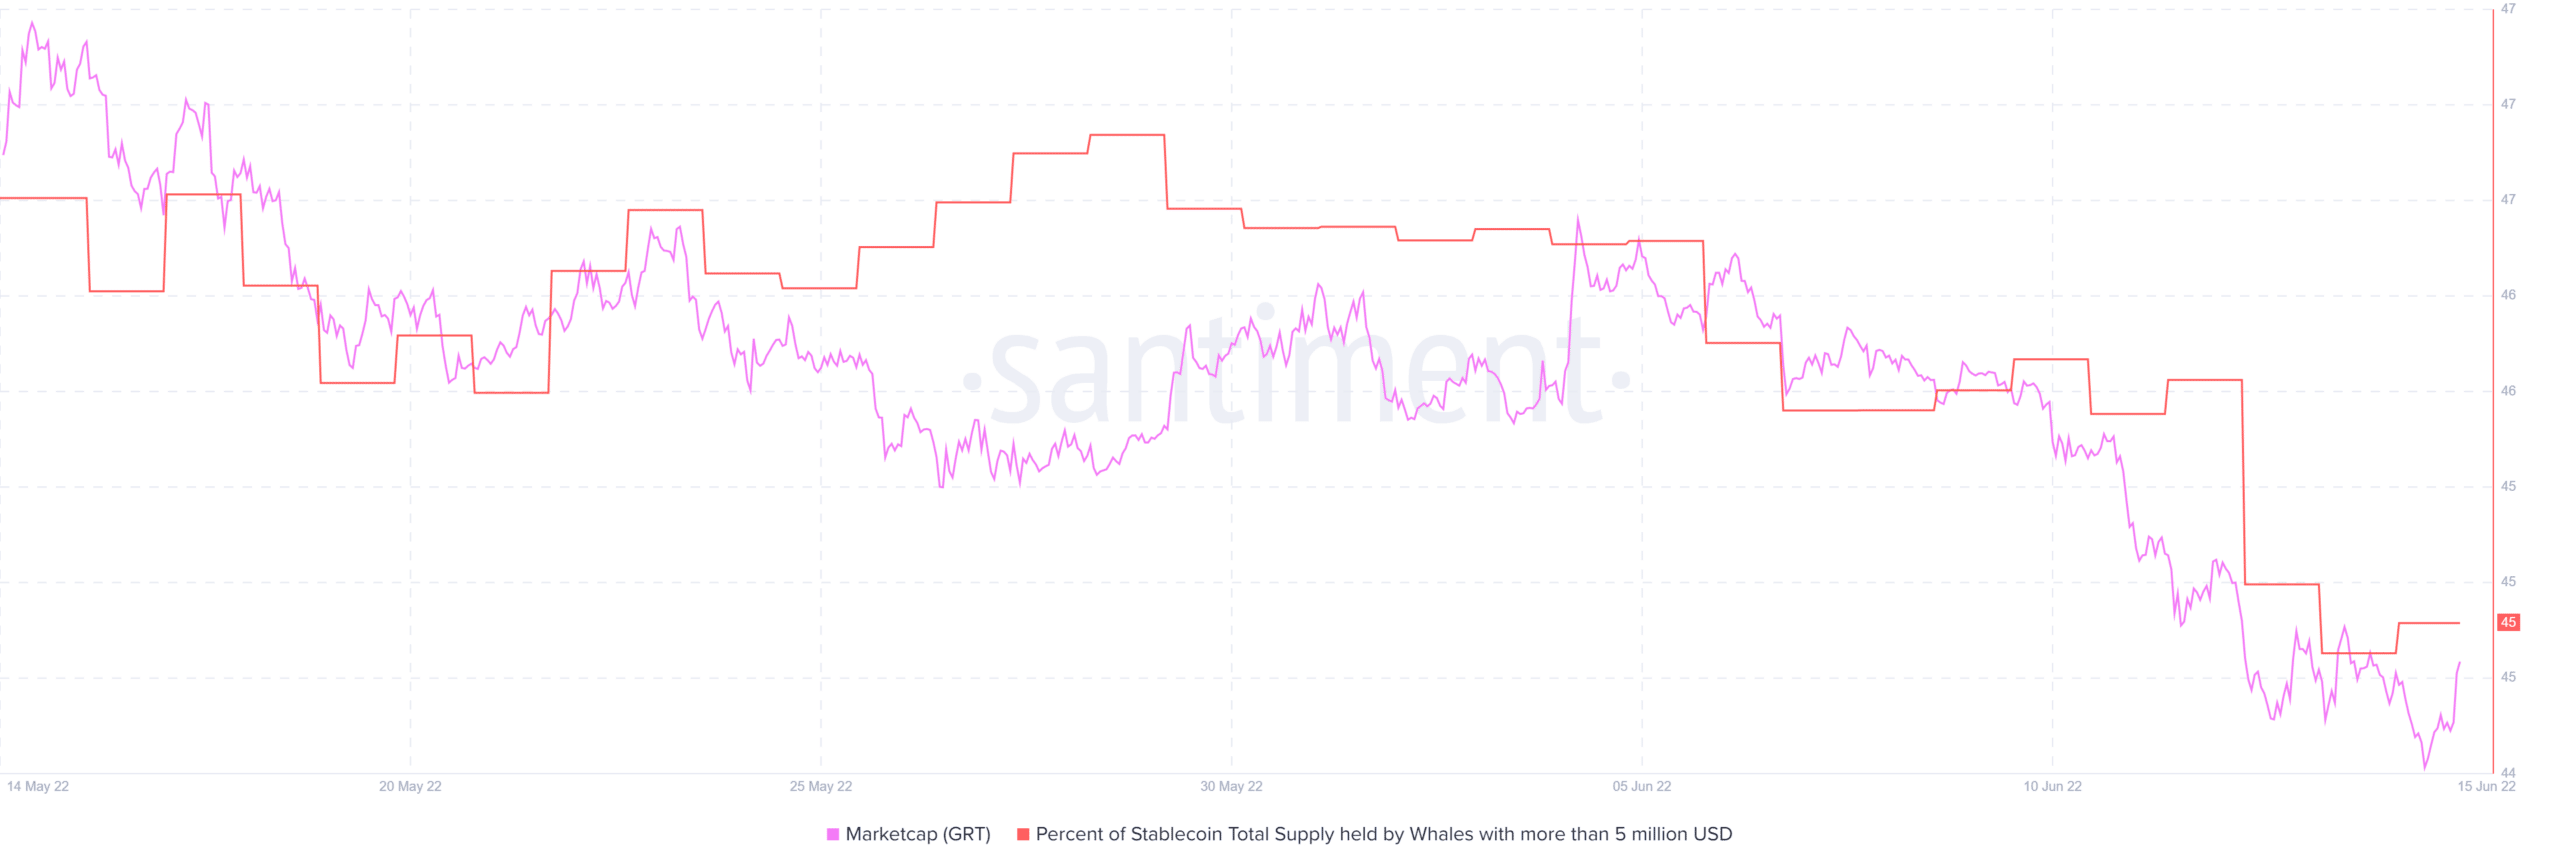
GRT’s latest price action reflects the on-chain activity captured by some of it on-chain metrics. For example, its market cap peaked at about $1.19 billion on 4 June before dropping to $655 million on 15 May. Its supply held by whales dropped 46.92% to 45.48% during the same time.
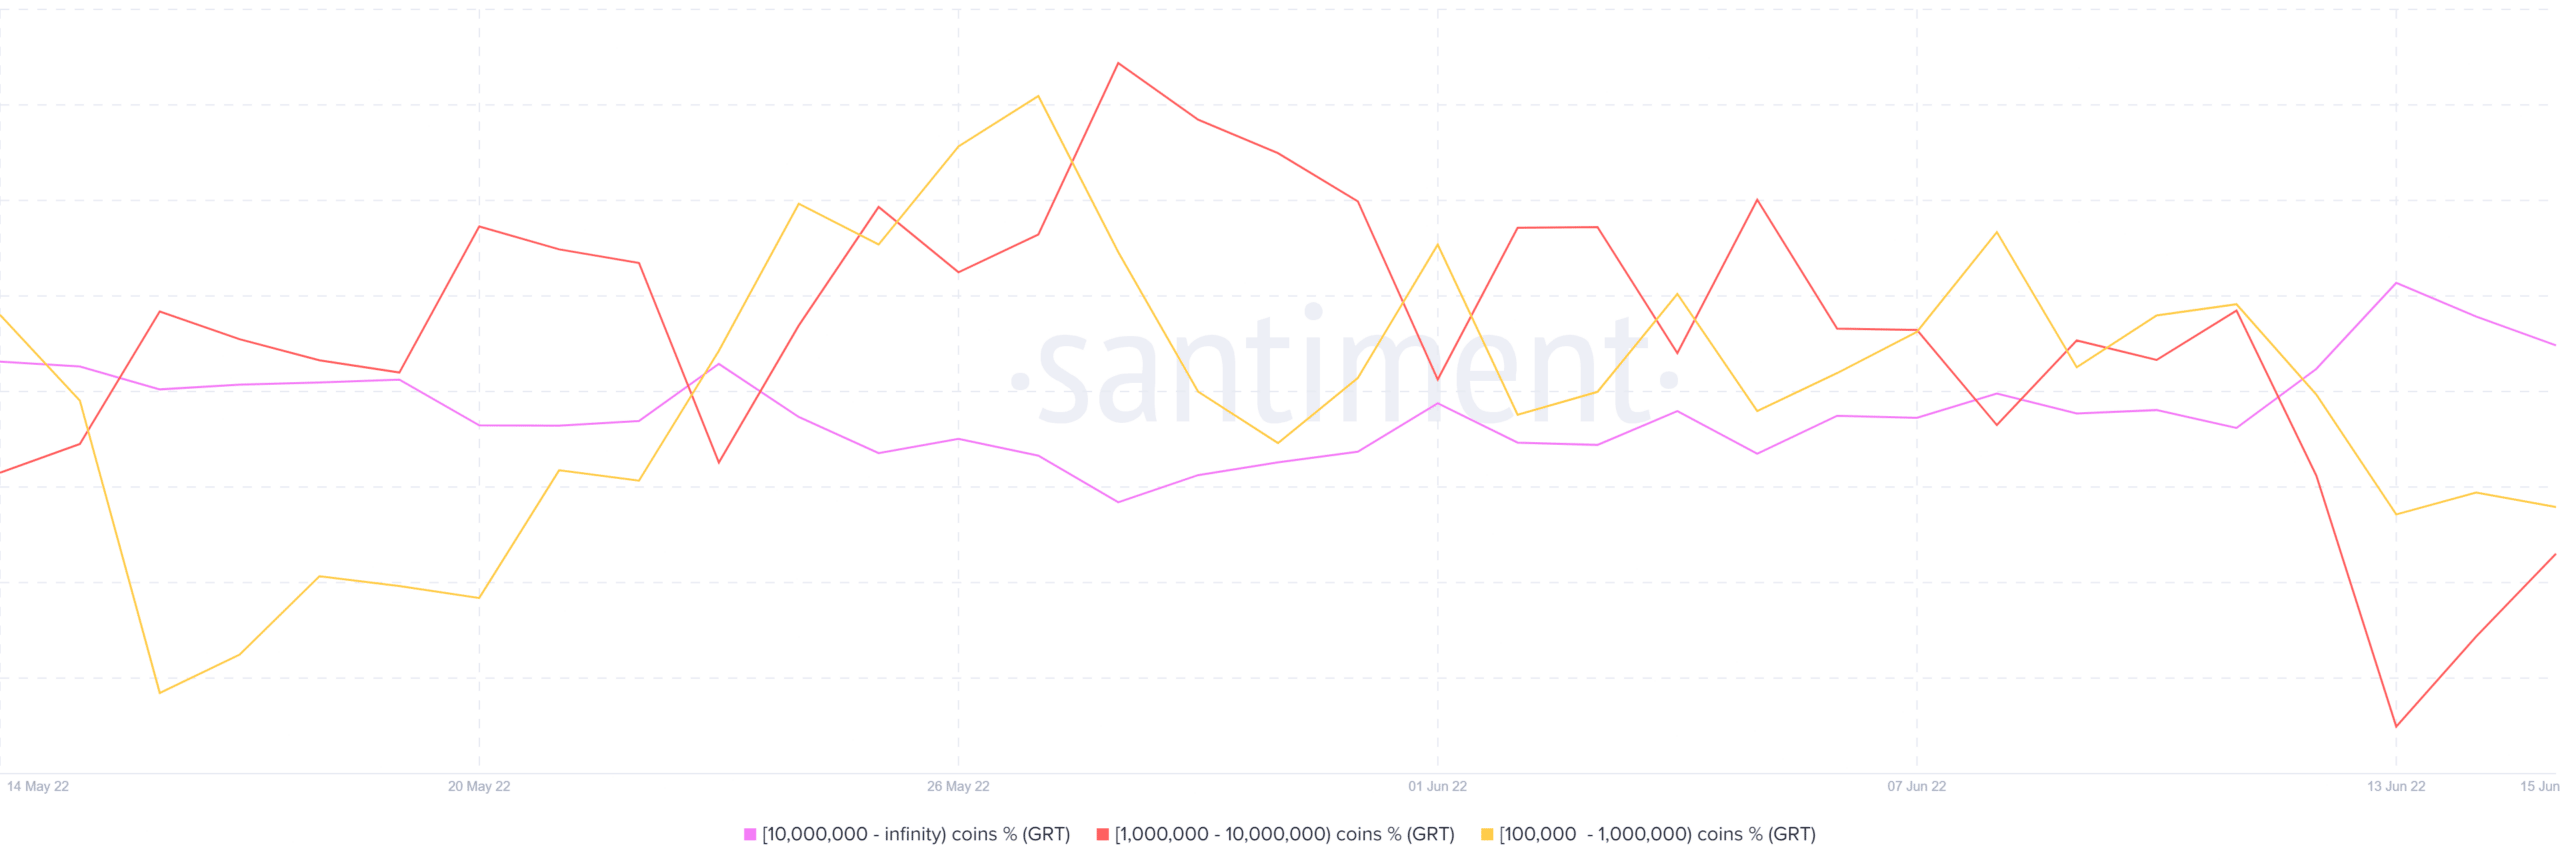
GRT’s price action in the next few days will largely depend on whale supply characteristics. Addresses holding more than 10 million GRT coins 91.38% on 11 June to 91.65% on 15 June. Meanwhile, addresses holding between 1 million and 10 million coins dropped from 5.54% to 5.28% during the same time. Addresses holding between 100,000 and 1 million coins dropped from 1.75% to 1.71%.
Conclusion
GRT’s price action mostly reflects the marginal increase in supply held by address with over 10 million coins. This is not surprising considering that this category holds the most chips. More importantly, the lack of strong accumulation suggests that GRT bulls might not be ready to take over yet. More downside means GRT will be available at discounted prices.