Algorand, The Sandbox, Fantom Price Analysis: 08 April

The altcoins analyzed appeared to have dropped to a logical area of demand, based either on retracement levels or a higher timeframe bullish order block. At the same time, coins like Algorand and The Sandbox appeared to form a bearish chart pattern even though they had a bullish near-term structure that could see nearly double-digit percentage gains. Provided that Bitcoin does not see another wave of intense selling, it appeared that these coins could see a rally and post respectable gains in the next couple of days.
Algorand (ALGO)
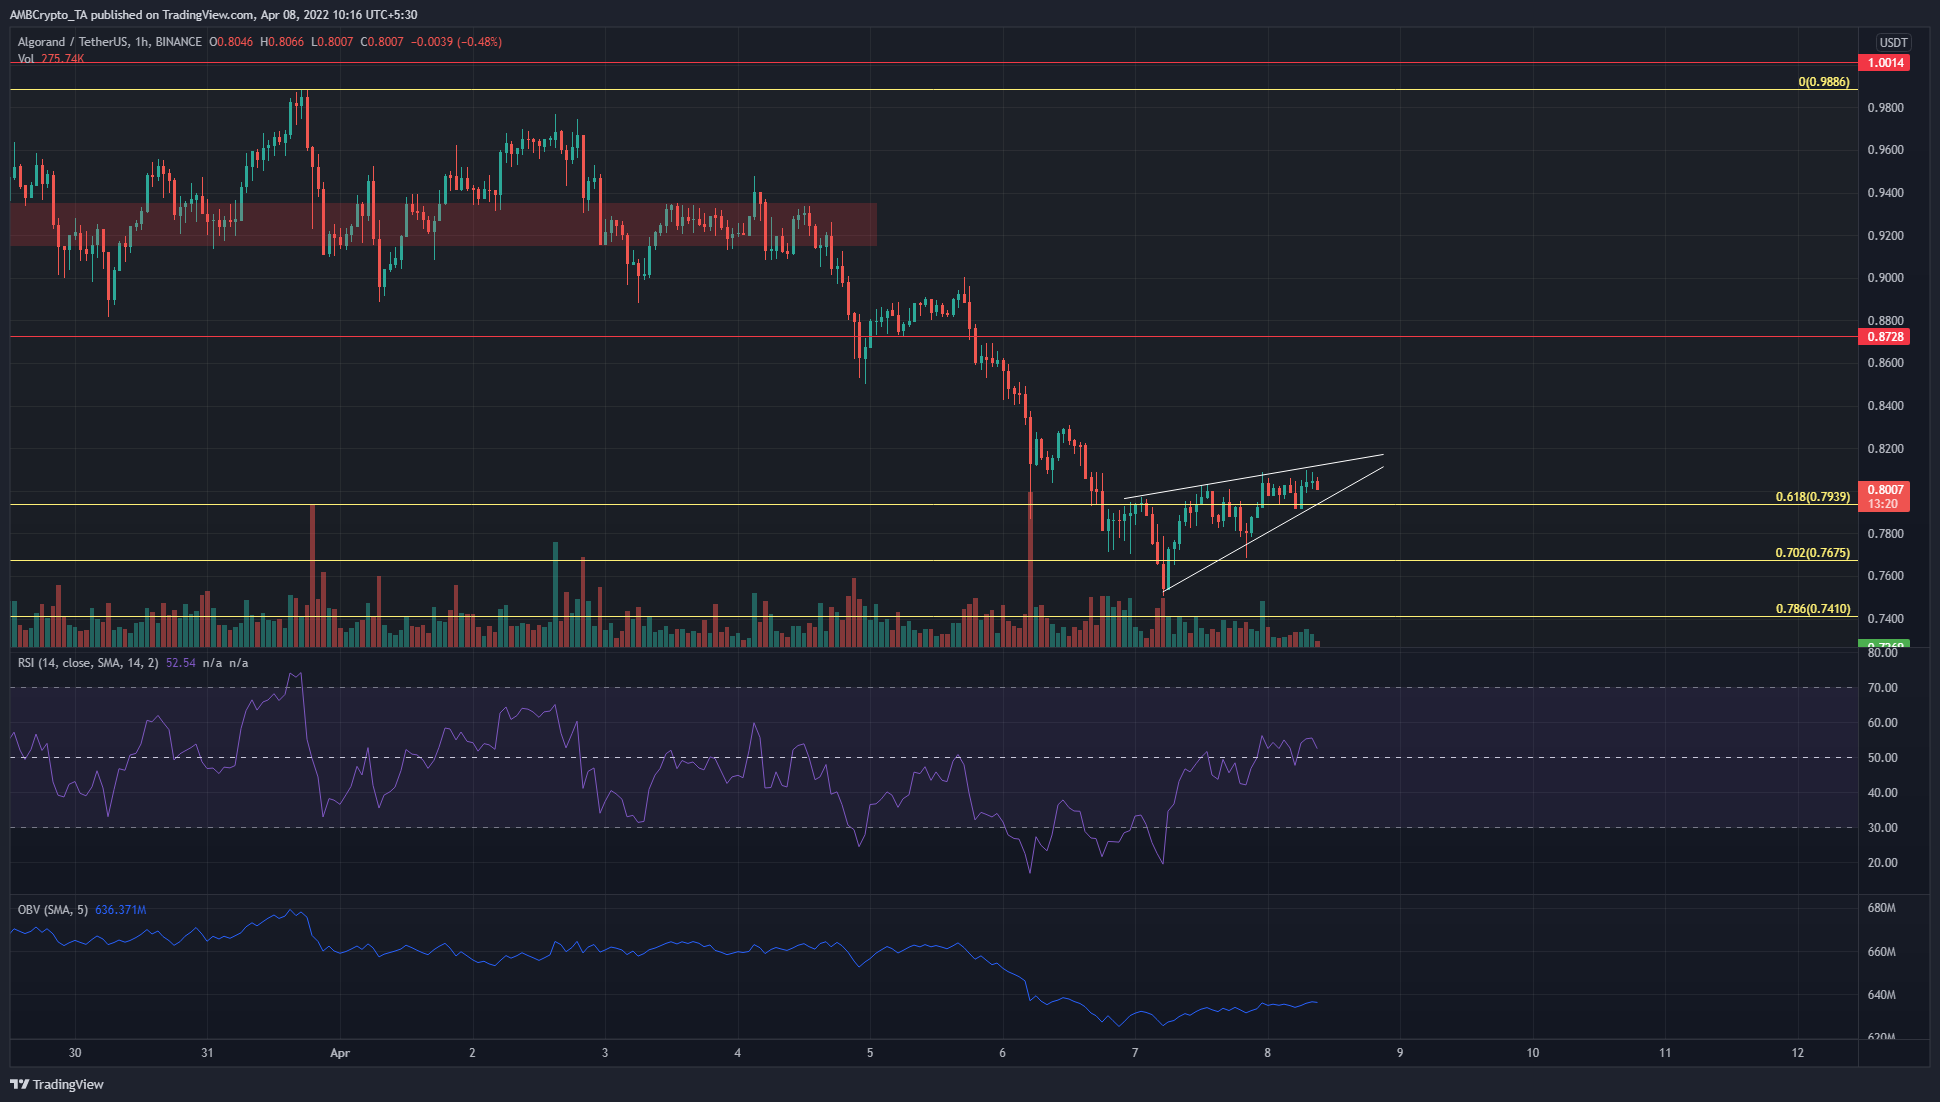
A set of Fibonacci levels (yellow) were drawn based on ALGO’s move from $0.673 to $0.988, initiated in mid-March. The 61.8% retracement level of this move lay at $0.7939, a level that Algorand appeared to have flipped to support in recent hours.
The RSI climbed above neutral 50 to suggest the beginning of bullish momentum. However, the OBV was in a downtrend in the past week, and the price also formed a rising wedge pattern. Hence, the further downside was a possibility to be wary of.
The Sandbox (SAND)
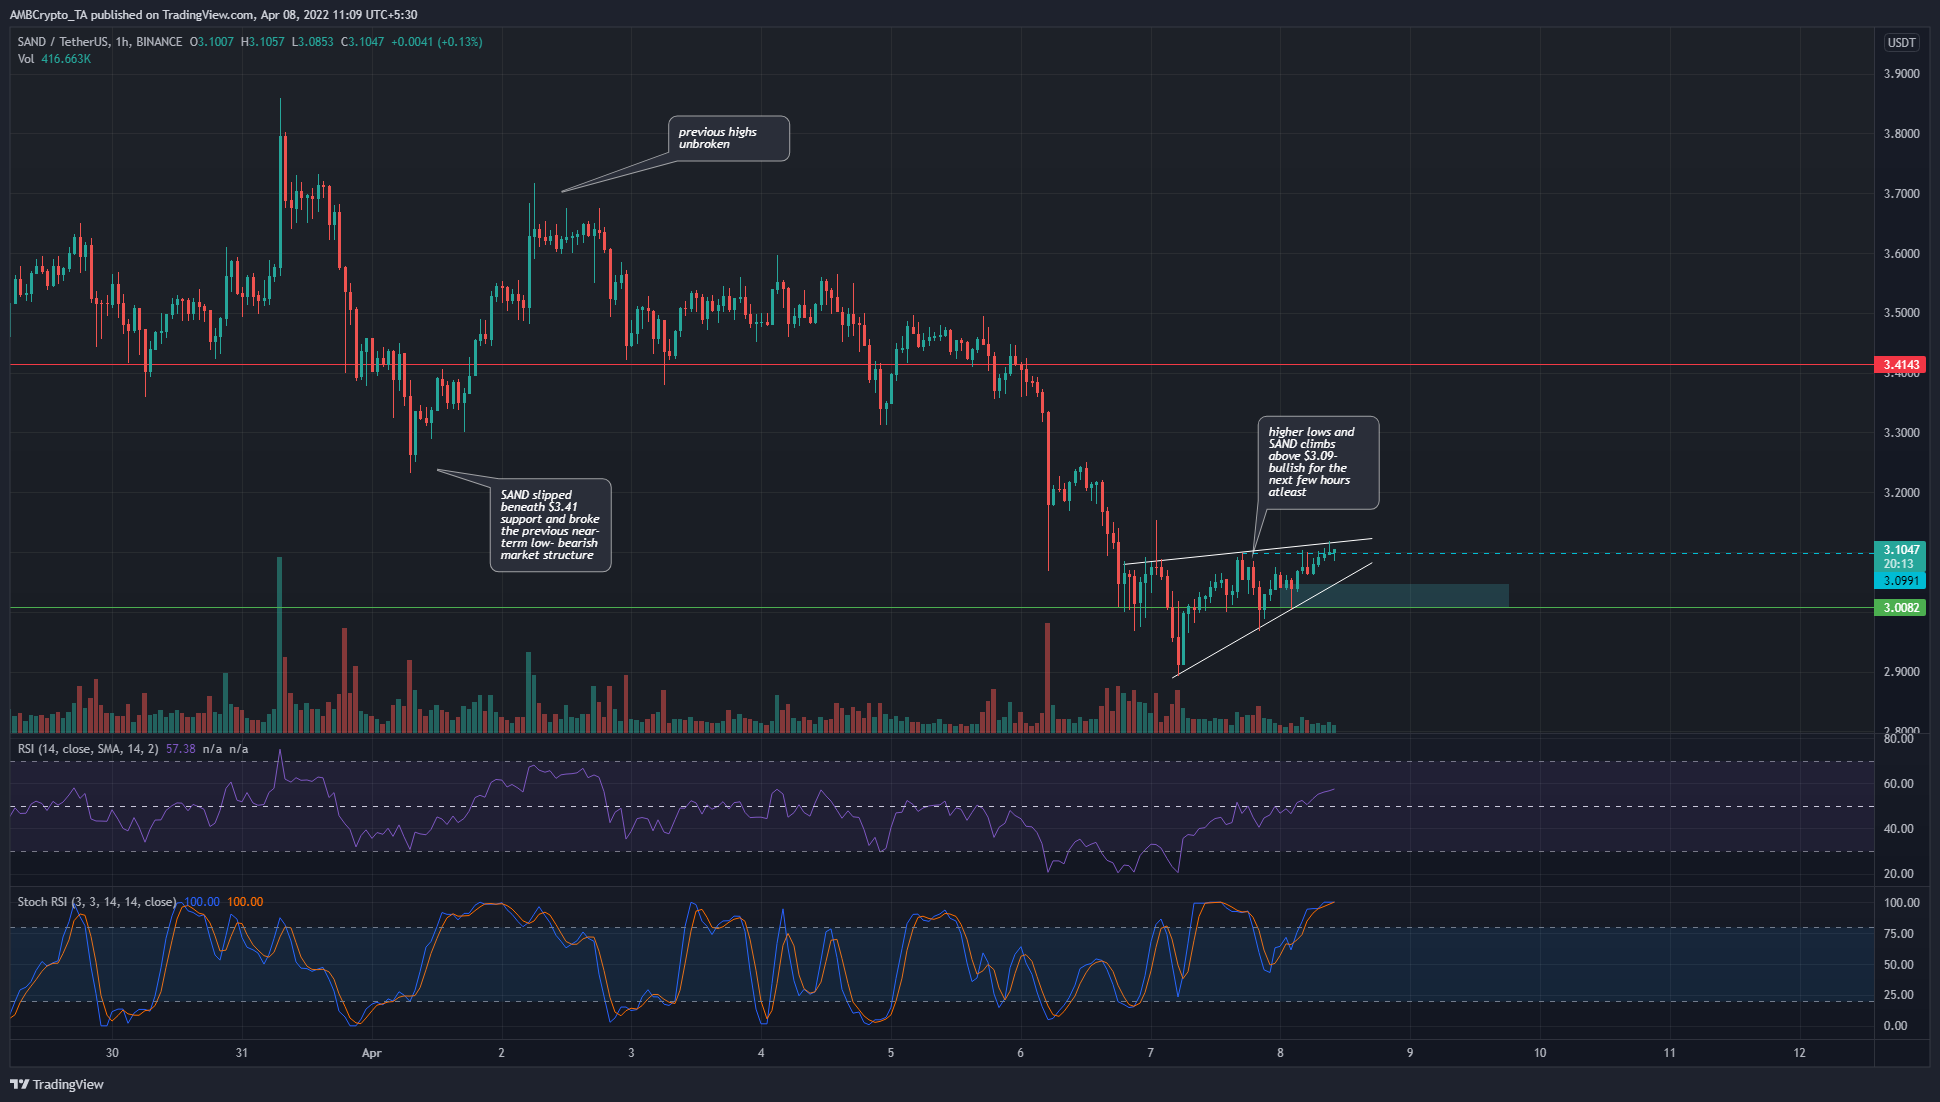
Once more, a rising wedge pattern (white) was discernable even though the short-term market structure was flipped to bullish. The $3 support level can expect to act as a demand zone in the next couple of days, should SAND witness a minor pullback from $3.1.
The RSI rose above neutral 50. Across the market, the momentum of altcoins on the hourly chart is beginning to gain some bullish traction. The Stochastic RSI was in overbought territory. A pullback to $3, if it presents itself, would be a buying opportunity.
Fantom (FTM)
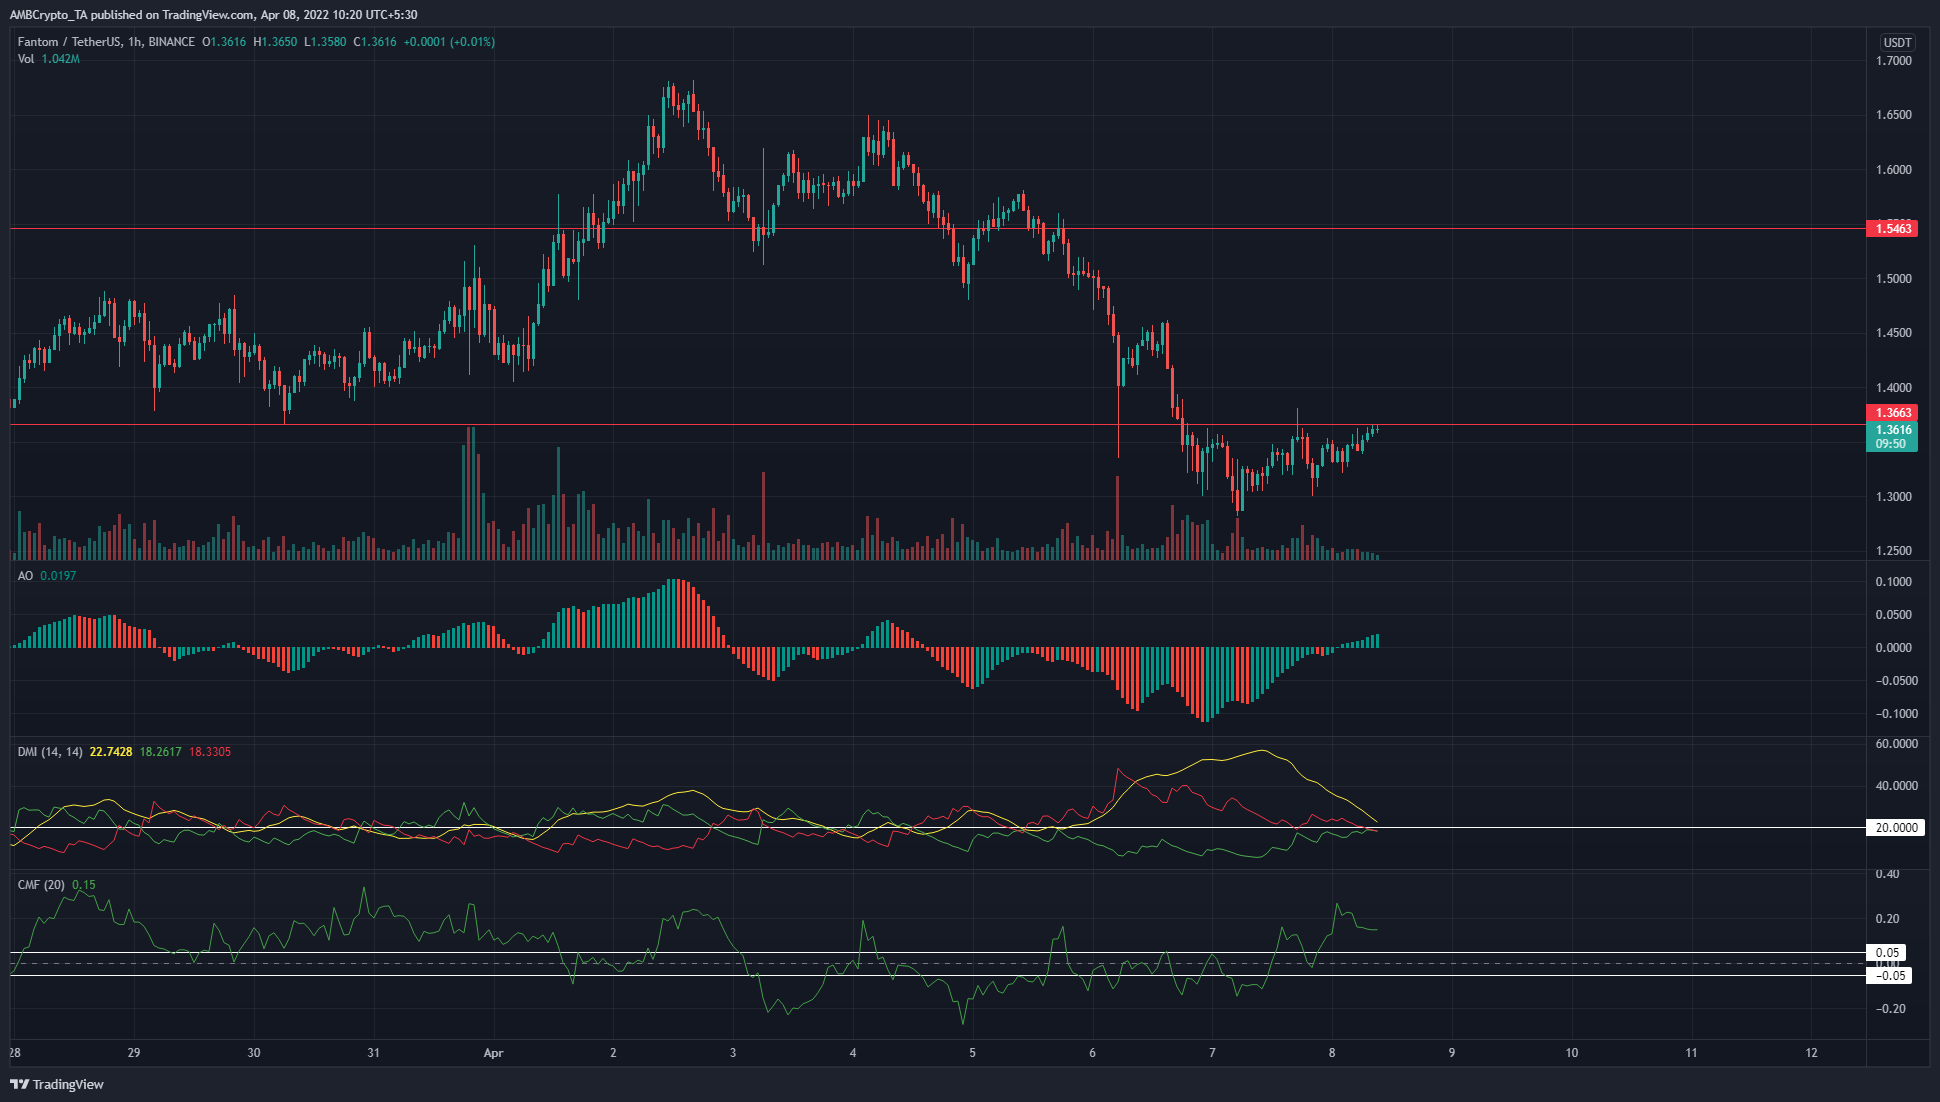
FTM was trading just beneath the $1.36 resistance level, but its indicators suggested that the bearish momentum was waning. The Awesome Oscillator climbed back above the zero line, while the Chaikin Money Flow (CMF) also pushed above the +0.05 mark the previous day.
The DMI showed that the bearish trend was losing strength as both the ADX (yellow) and the -DI (red) dipped toward and below 20.