
Disclaimer: The findings of the following analysis are the sole opinions of the writer and should not be taken as investment advice
While Bitcoin Cash’s market has not blown up in recent months, the alt did provide steady returns to investors with lower risk appetites. Its weekly and monthly ROIs stood at 3.8% and 58%, respectively, at press time. Now, while these figures may not be as boastful as those of SOL and XRP, BCH has certainly kept up with the broader market trend.
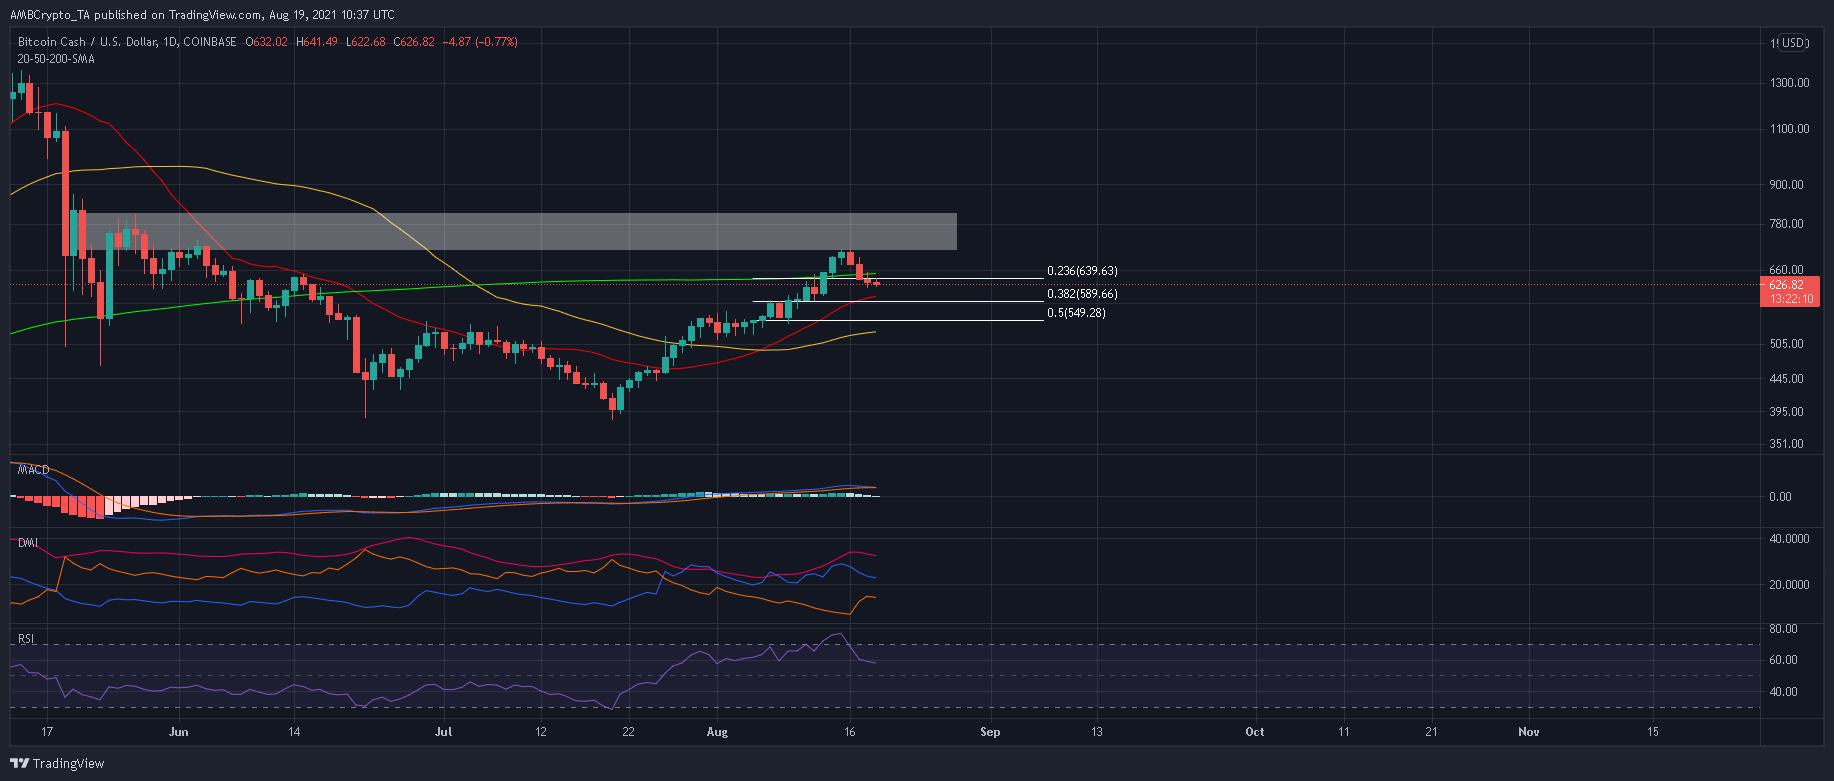
On the charts, the price has seen a steady uptrend since late July. Alas, it did disappoint after it failed to clear a crucial resistance zone. At the time of writing, Bitcoin Cash was being traded at $626 and held the 12th position on CoinMarketCap.
Bitcoin Cash Daily Chart
Source: BCH/USD, TradingView
A double bottom formation in late July kickstarted a much needed reversal after the alt continued to shed more value post the 19 May crypto-plummet. BCH faced little to no hiccups in its attempt to close above the 50% Fibonacci Retracement level ($549) but was unable to topple the next ceiling present between $710-$760. The Fibonacci tool further highlighted some support areas from where BCH can stabilize and take another jab at the aforementioned resistance.
The 38.2% Fibonacci level ($589.6) seemed to be an attractive level for buyers to step in. On the contrary, a retest of the 50% Fibonacci level would send tremors of a sharper market retracement.
Reasoning
BCH’s indicators flashed some near-term risks which could amplify if the bulls fail to respond quickly. The MACD was close to a bearish crossover after upwards pressure receded over the past few days. A fall below the half-line would present sell signals, further dampening BCH’s mid-long term outlook.
The Directional Movement Index’s findings suggested that BCH’s uptrend was losing steam. On the other hand, the Relative Strength Index was close to 60 and underlined bullish strength in the market.
The 40-50 range would most likely act as support in case of further southbound movement.
Conclusion
Bitcoin Cash can be expected to form a newer low before retesting its resistance zone of $710-$760. A fall towards the 38.2% Fibonacci level ($589.6) would be an ideal buy entry for traders wishing to capitalize on the next rally. On the other hand, a retest of the 50% Fibonacci level would leave the market exposed to a bearish shakedown.