Analyzing APT, DYDX after their latest token unlocks
APT and DYDX, both, witnessed a price decline of at least 8% in the last 24 hours. However, a price decline and an increment in trading volume could be considered a common affair after token unlocks.
![Analyzing states of Aptos [APT] and Dydx [DYDX] after their latest token unlocks](https://ambcrypto.com/wp-content/uploads/2023/06/APT.png)
- APT and DYDX’s prices declined by nearly 8% in the last 24 hours
- DYDX’s four-hour chart was bearish, but APT’s chart gave hope for a trend reversal
Token Unlock’s recent tweet revealed that tokens worth more than $62 million were unlocked last week. Out of them, the two major unlocks were Aptos [APT] and Dydx [DYDX].
Unlocks are generally followed by price declines. This happens as the circulating supply increases. As per the demand-supply theory, when supply increases, the latter goes down, causing prices to plummet.
🔓This week's cliff unlocks over $62 million 🔓
✨ Highlight Unlocks are $APT & $DYDX ✨$APT 0.5% – $40.12 m 🌟$DYDX 0.7% – $13.89 m 🌟$HOP 2.0% – $1.53 m$HFT 0.3% – $1.47 m$GLMR 0.3% – $0.86 m$TORN 1.8% – $0.67 m$GAL 0.2% – $0.55 m
.
.Link ⛓️ : https://t.co/8XoTR8tBPT pic.twitter.com/XJRZtsfjhj
— Tokenomist (@Tokenomist_ai) June 5, 2023
Read Aptos’ [APT] Price Prediction 2023-24
Updated tokenomics of Aptos and Dydx
As per Token Unlock’s tweet, 0.5% of Aptos’ total supply was released, which was worth more than $40 million. On the other hand, 0.7% of DYDX’s total supply was unblocked.
The newly released DYDX tokens were worth over $13 million. Because of the release, at press time, APT’s circulating supply was 199,990,767, while DYDX’s figure stood at 156,256,174 DYDX.
The trend of a price decline after token unlocks continued even this time, as both tokens registered declines. According to CoinMarketCap, both tokens were down by nearly 8% in the last 24 hours. Furthermore, at the time of writing, APT was trading at $8.03 and DYDX was valued at $1.95.
On-chain performance looked similar
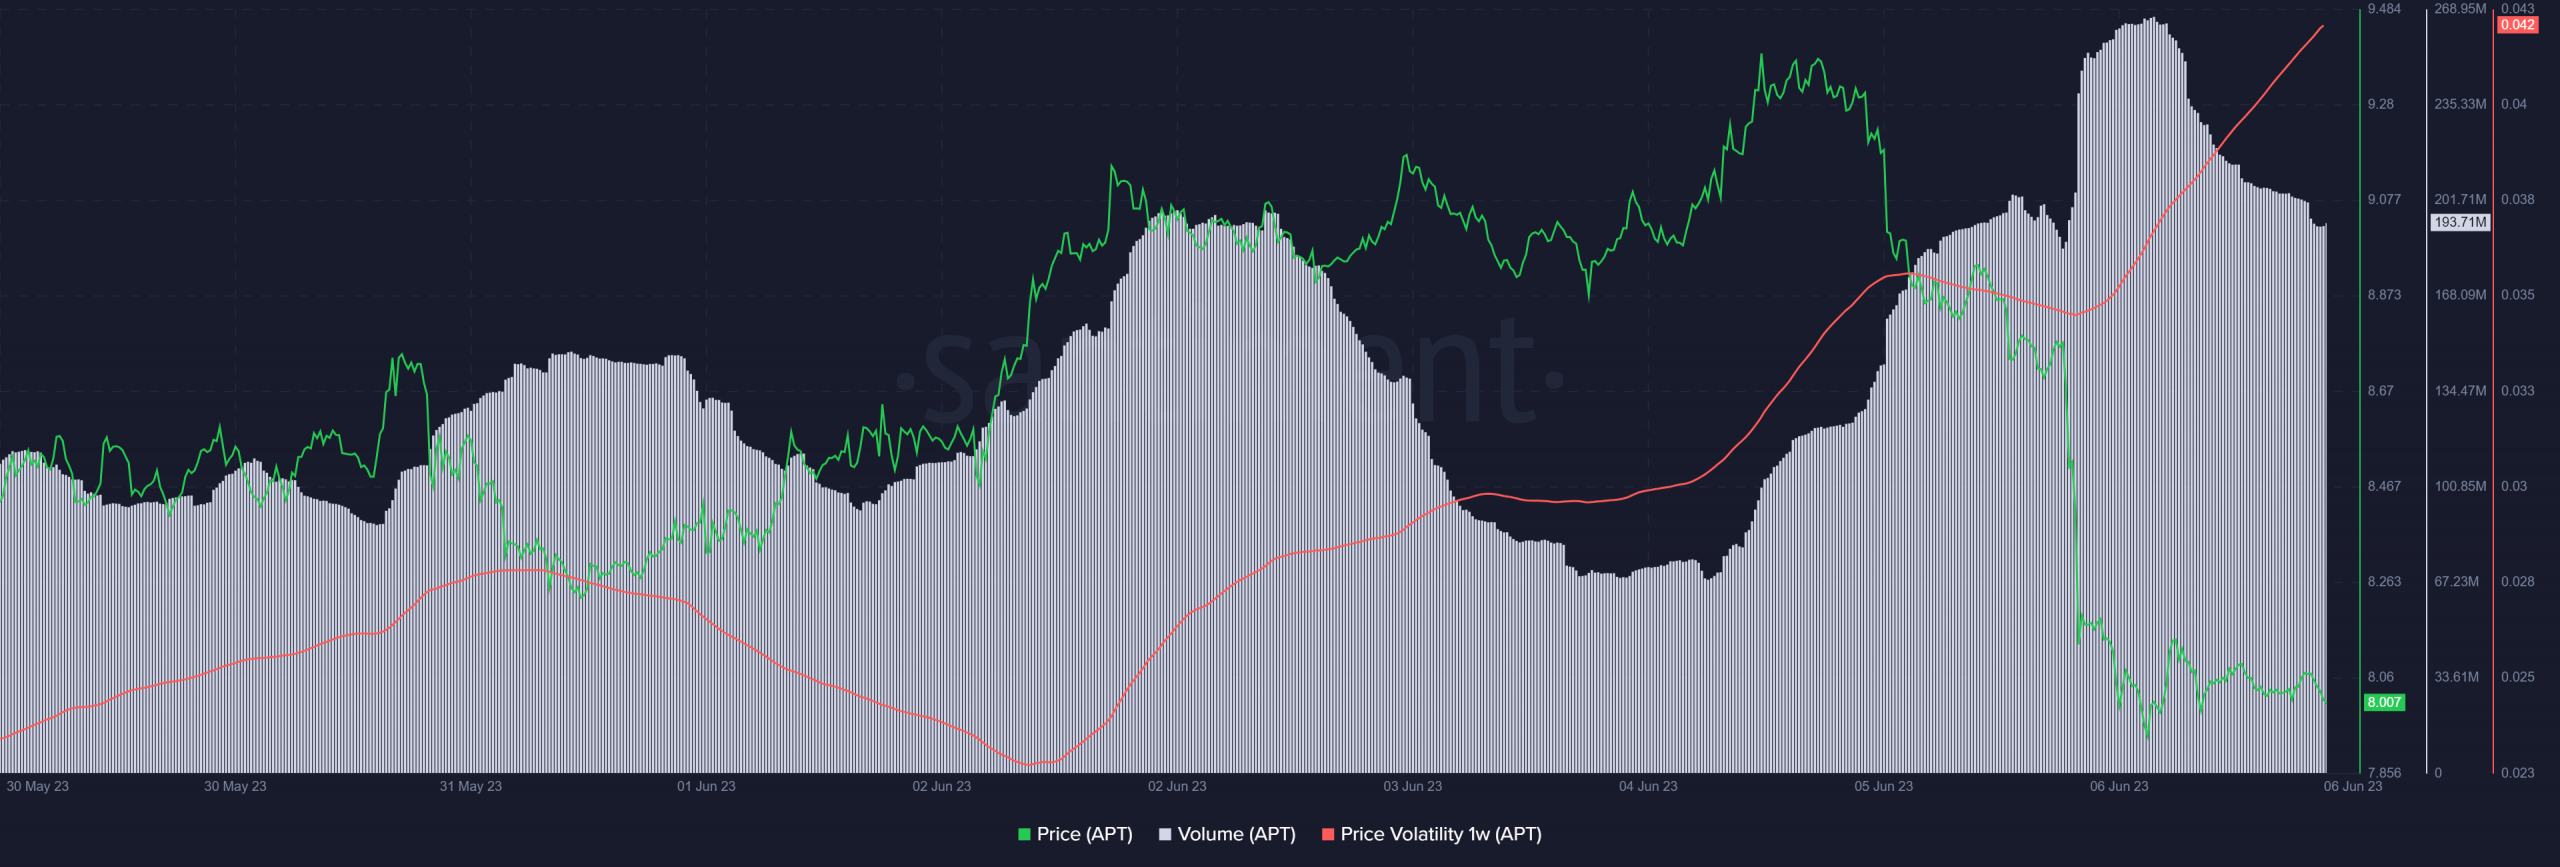
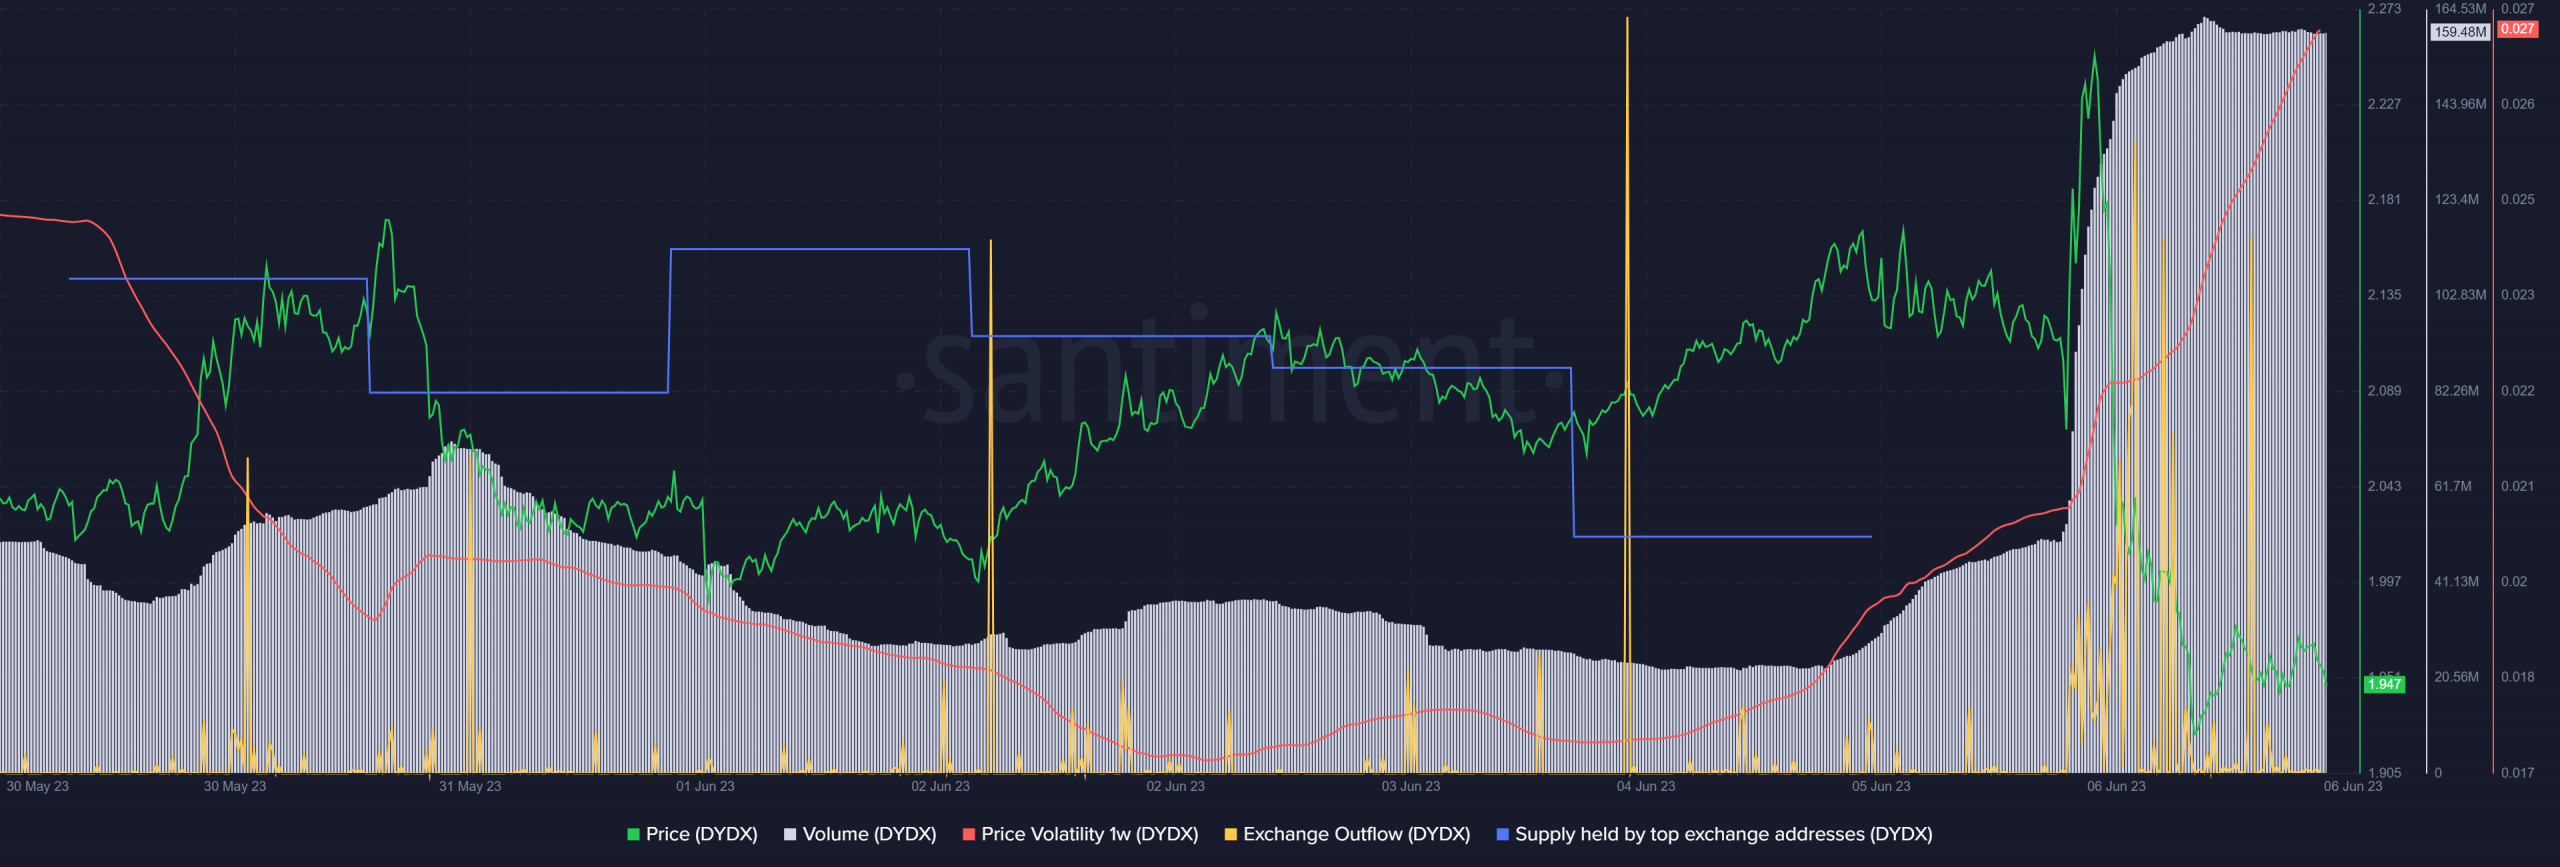
Both tokens witnessed a massive increase in trading volume while their prices declined. This was a typical bearish signal. Moreover, their one-week price volatility also shot up, further increasing the chances of a continued downtrend.
Additionally, in DYDX’s case, exchange outflow spiked considerably during that period, which was also bearish. Investors’ confidence in DYDX also declined, as evident from the dip in its supply held by top addresses.
Market sentiment remained different
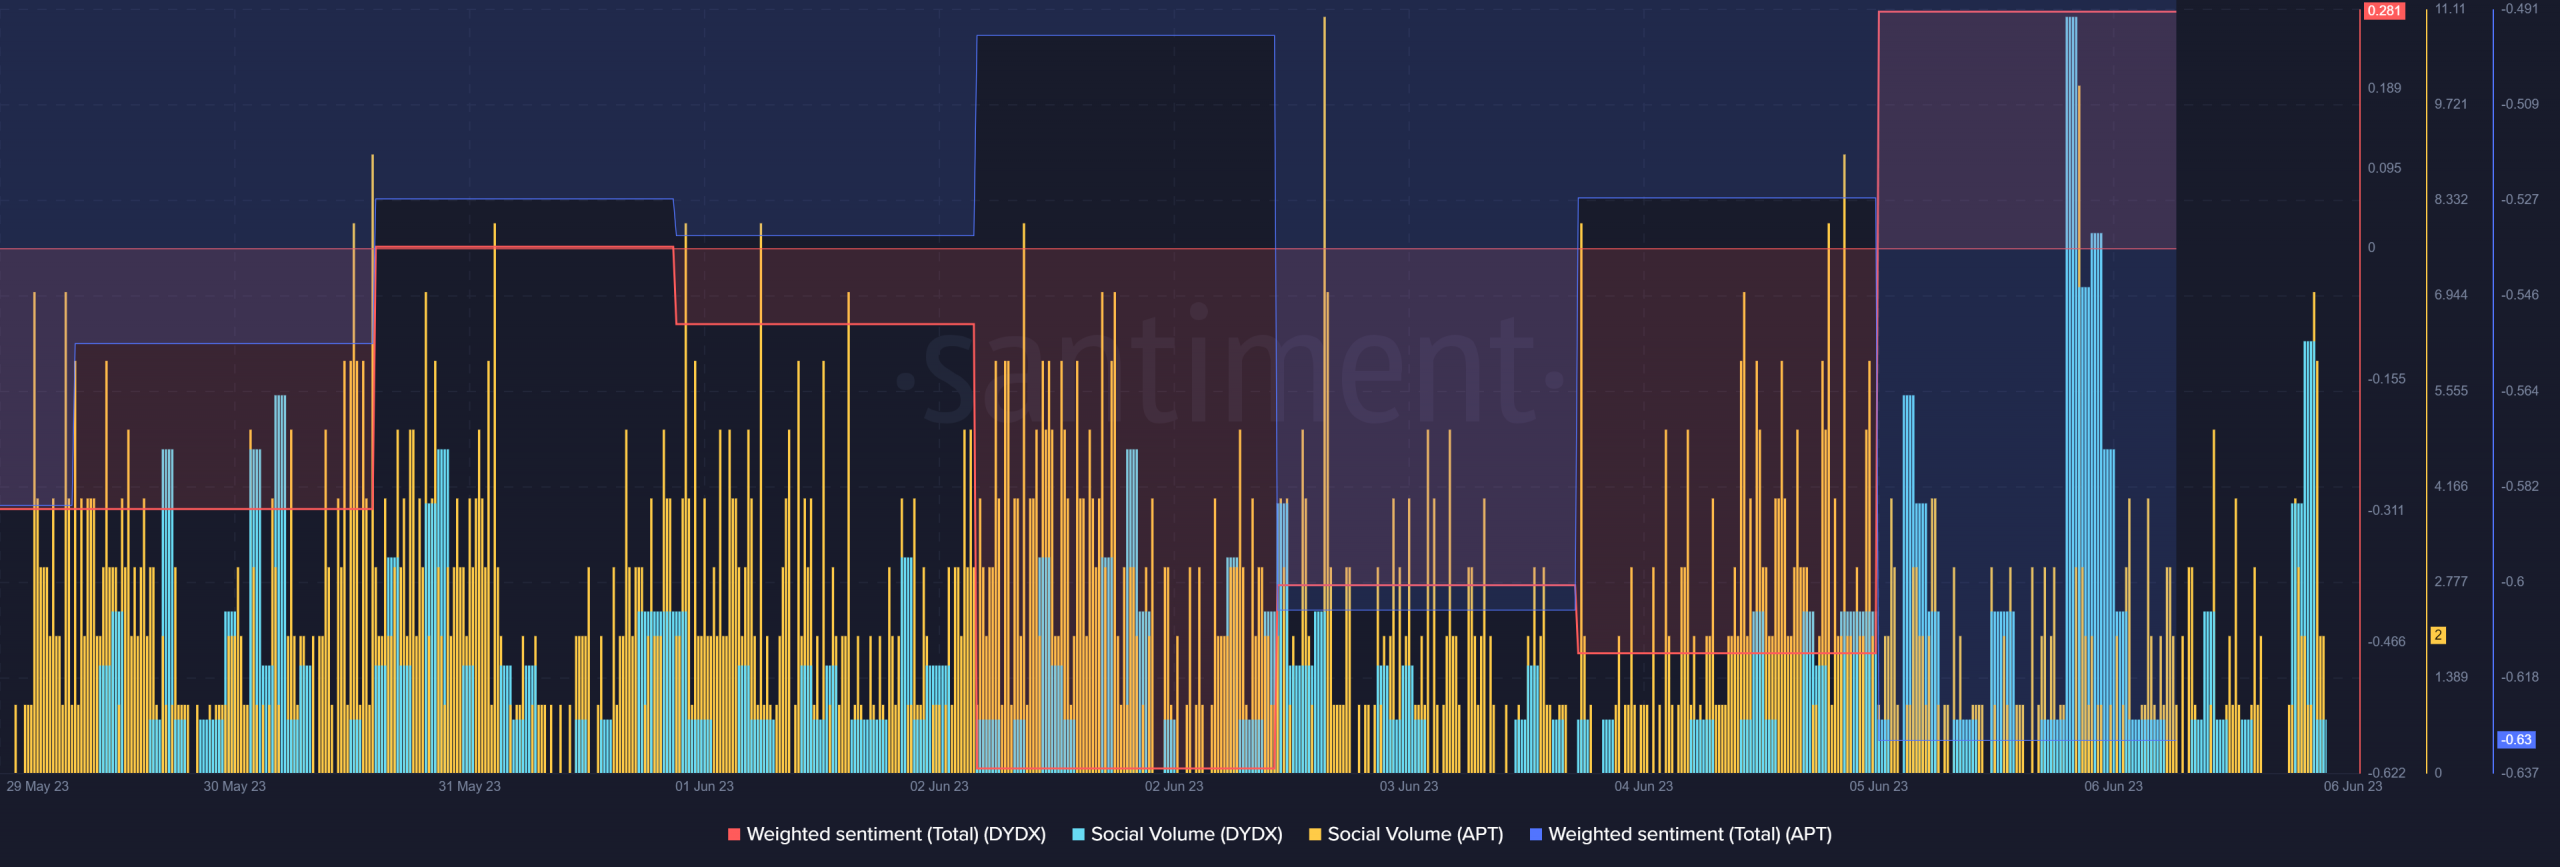
It was interesting to see that though both tokens’ social volumes were relatively high, market sentiments were however different. Santiment’s chart revealed that negative sentiment around APT was dominant in the market. But the opposite was true for DYDX as its weighted sentiment went positive.
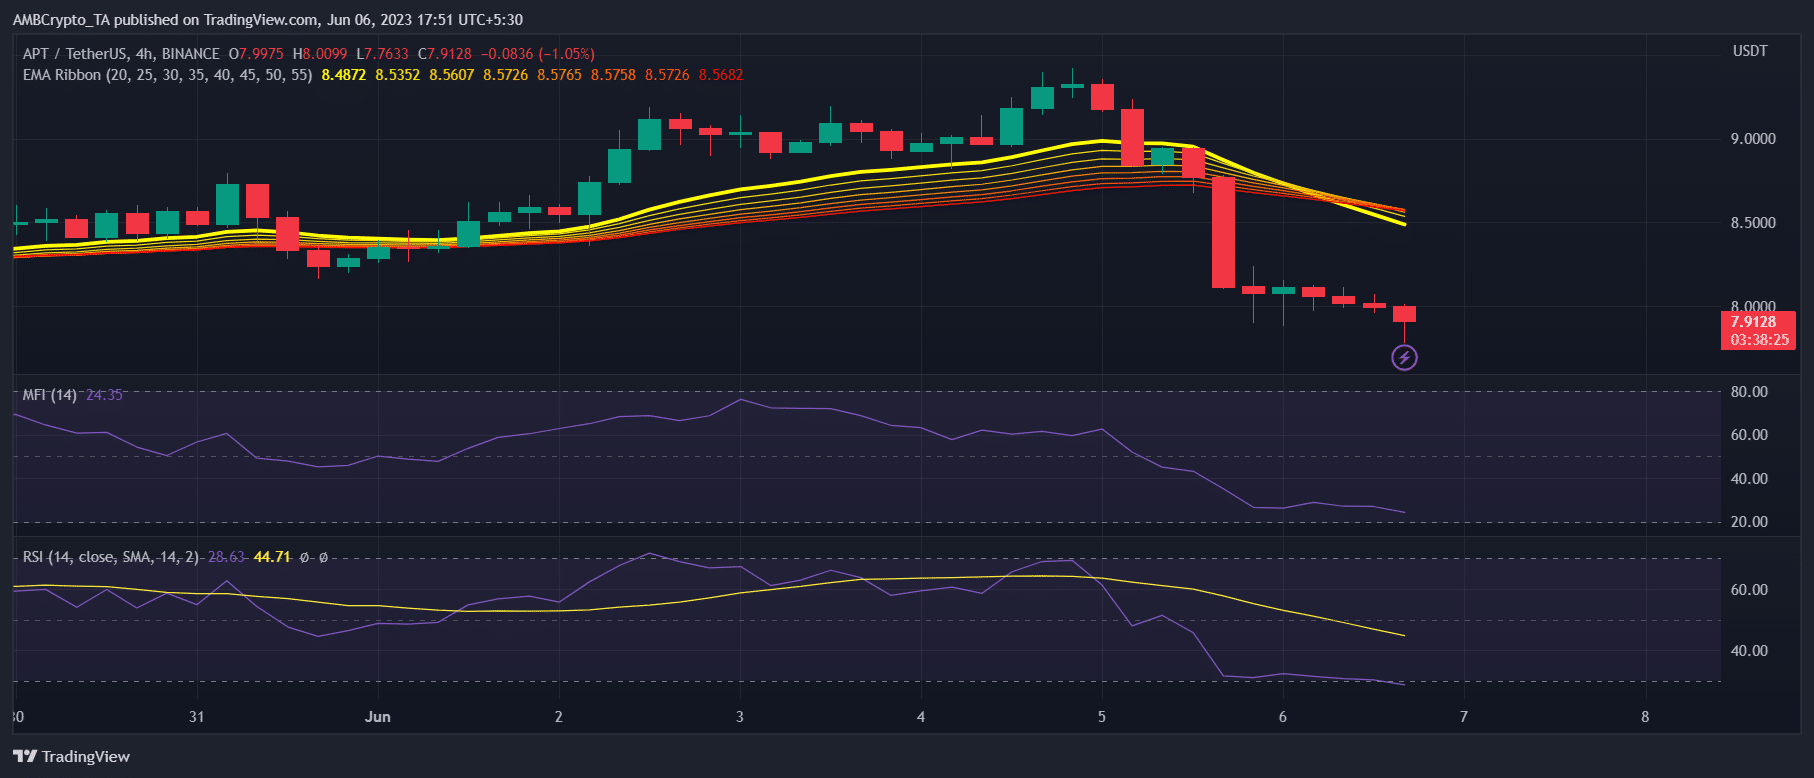
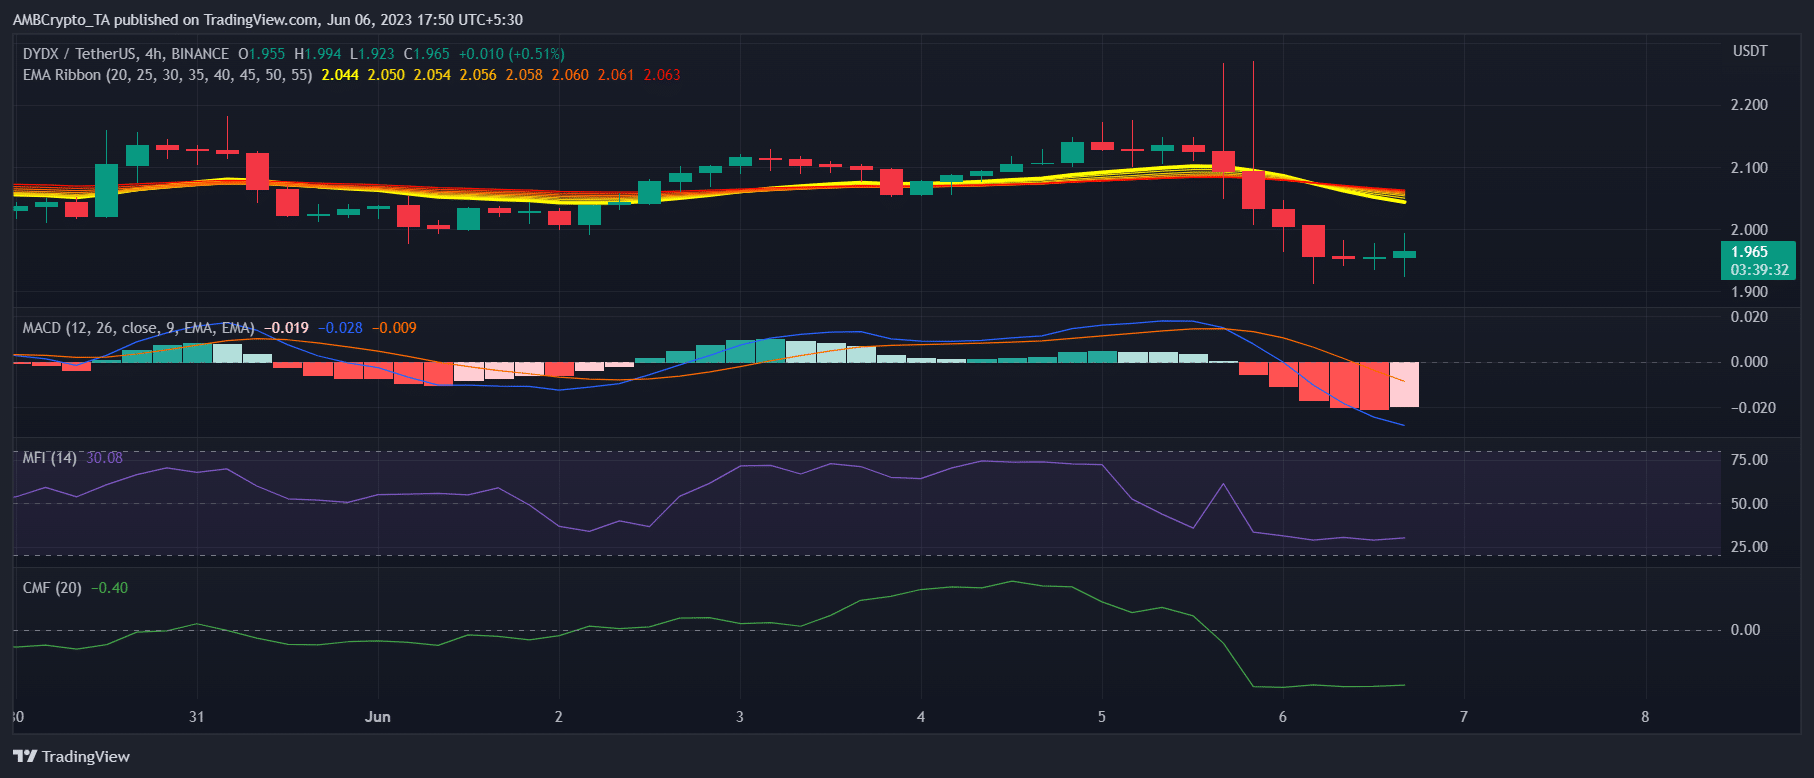
Additionally, like multiple metrics, their four-hour charts were also pretty similar and showed that the bears were ahead of the bulls. DYDX’s Exponential Moving Average (EMA) Ribbon displayed a bearish crossover as did its Moving Average Convergence Divergence (MACD). Its Money Flow Index (MFI) and Chaikin Money Flow (CMF) took a sideways path, suggesting a further price decline.
Realistic or not, here’s DYDX market cap in BTC‘s terms
Though APT’s EMA Ribbon was bearish, a few other metrics gave hope for a trend reversal. For instance, its Relative Strength Index (RSI) and Money Flow Index (MFI) were resting near the oversold zone. This could be a sign of increased buying pressure in the coming days.