ApeCoin investors must consider these factors before going long on APE

Disclaimer: The findings of the following analysis are the sole opinions of the writer and should not be considered investment advice.
- ApeCoin saw a bearish patterned break as the sellers expedited their pressure over the last few days.
- The crypto’s funding rates on Binance and FTX turned negative, can the buyers bounce back?
After attaining its All Time High (ATH) levels at the end of April this year, ApeCoin [APE] consistently plunged over the last seven months. The decline entailed a trendline resistance (white, dashed) on the daily chart.
Here’s AMBCrypto’s price prediction for ApeCoin [APE] for 2023-24
The recent bearish pattern breakout induced a streak of red candles. The price action headed toward its immediate support zone in the $4.2 region.
While the price declined below the EMAs, the near-term prospects favored the sellers. At press time, APE traded at $4.338, down by 7.4% in the last 24 hours.
Can APE buyers prevent a breakdown from its bearish pattern?
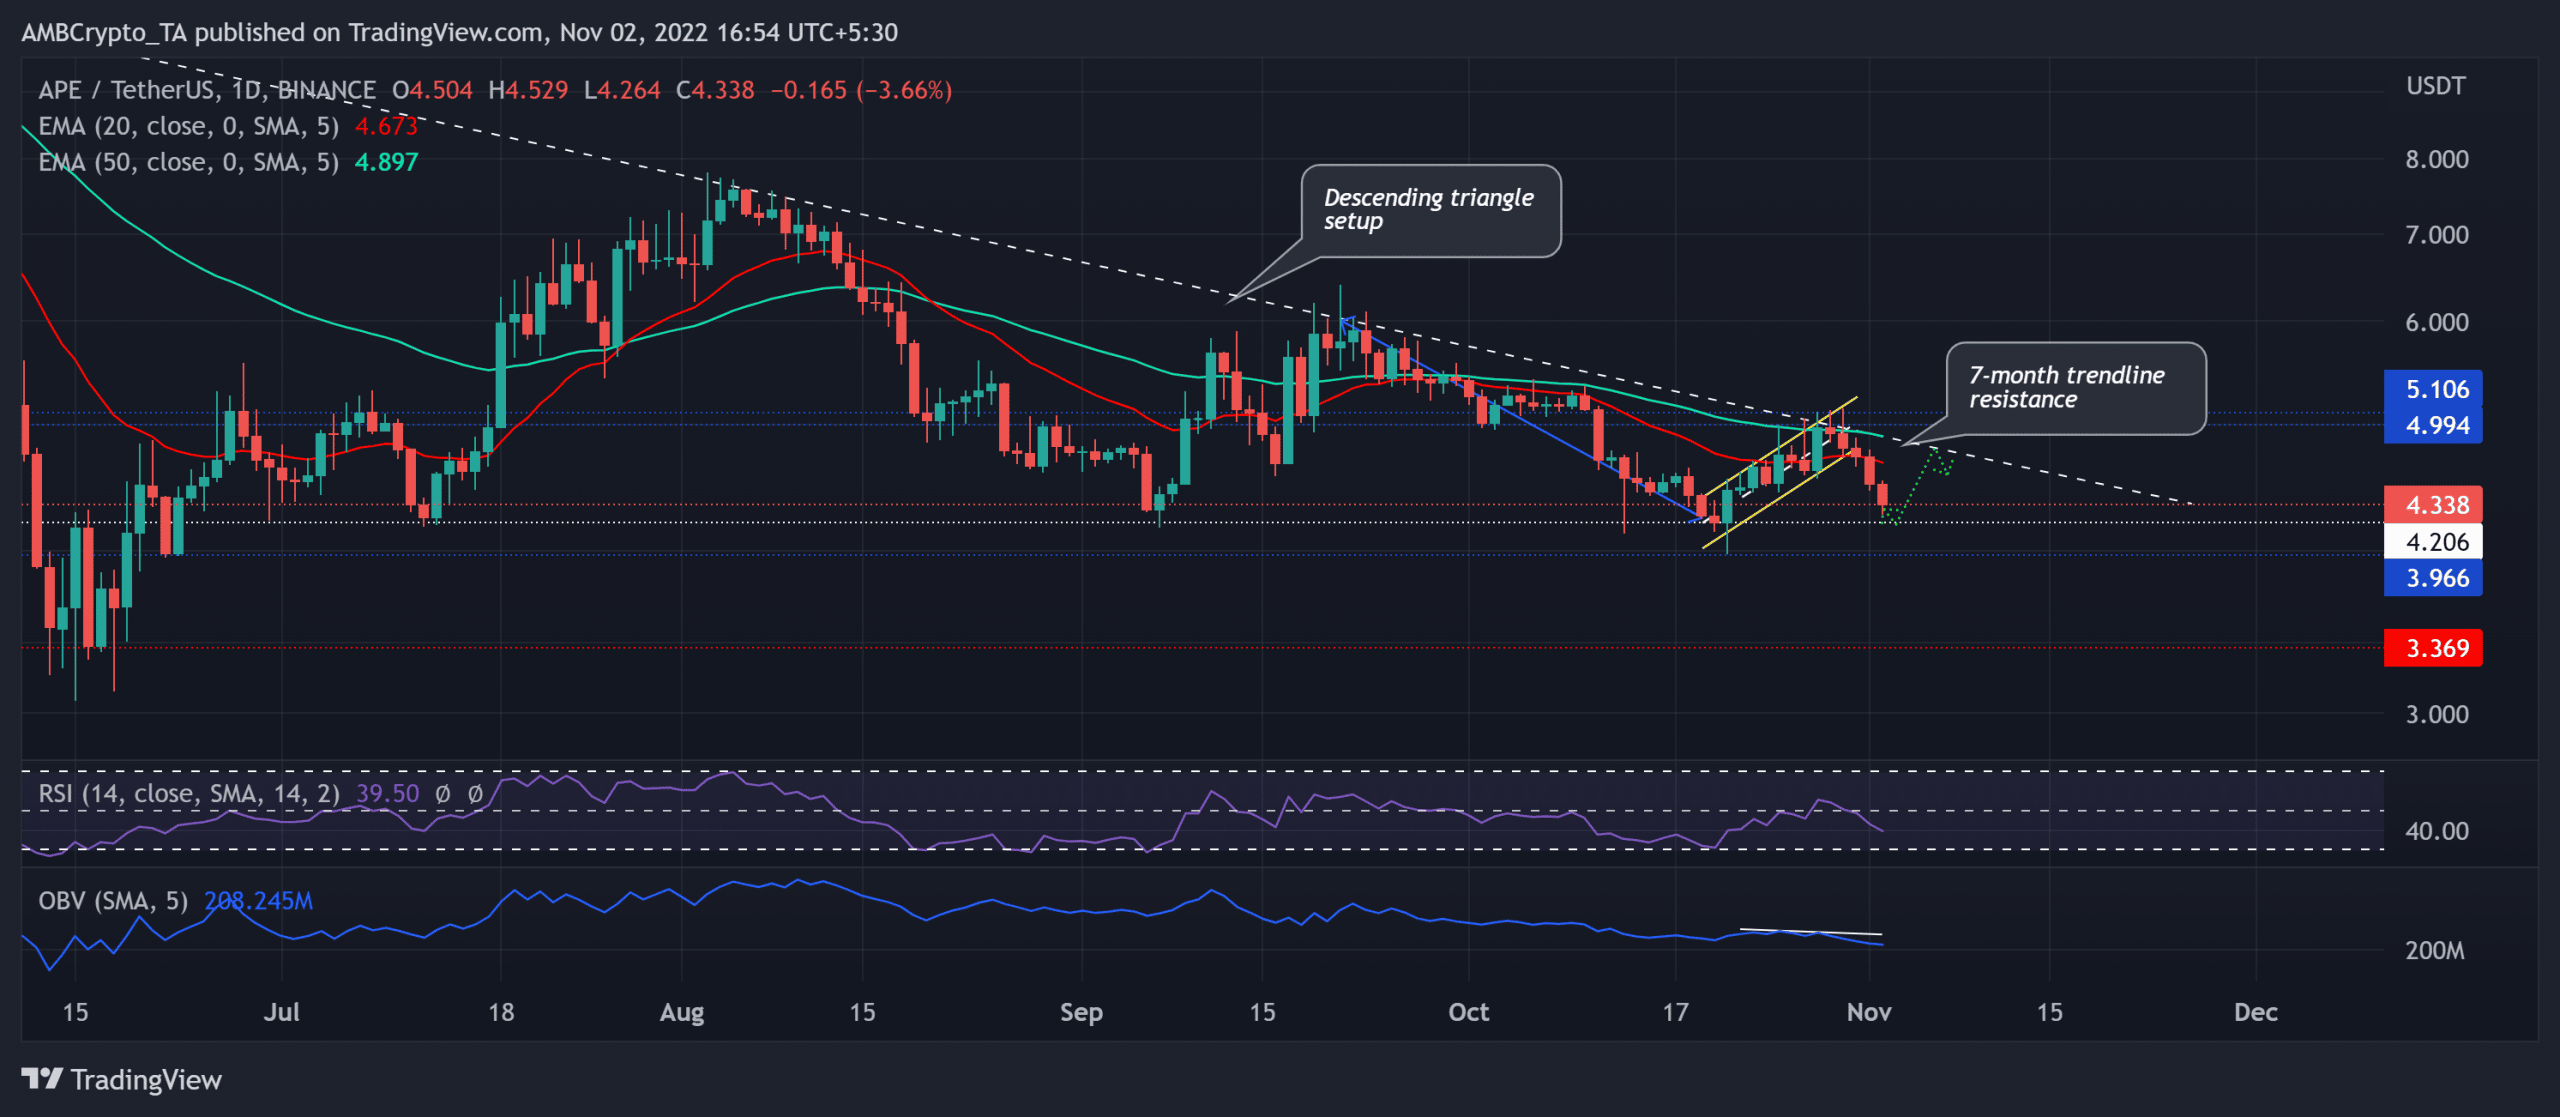
After a significant decline of over 88% from its ATH levels, APE gravitated toward its All-time low on 15 June. Since then, the token strived to alter the bearish narrative but the seven-month trendline resistance constricted all buying efforts.
The recent recovery efforts translated into a bearish flag on the daily timeframe. The trendline resistance inflicted a reversal that eventually led to a breakdown. With the 20 EMA (red) and the 50 EMA (cyan) looking south again, the bears would look to control the near-term trend.
In the meantime, APE marked a descending triangle setup on its daily chart as the bears provoked lower peaks on flatter lows over the past few weeks.
A potential rebound from the $4.2 baseline can provoke an immediate pullback. In this case, the trendline resistance could restrict the bullish resurgence in the $4.8-$4.9 range. A close below the $4.7-level could expose the alt to a further downside. In this case, the sellers would look to inflict a further pull down toward the $3.6-$3.9 range.
The Relative Strength Index (RSI) declined below the equilibrium to depict an increasing bearish edge. Furthermore, the On-Balance Volume (OBV) lower peaks affirmed a bearish divergence with the price action.
A decline in funding across all exchanges
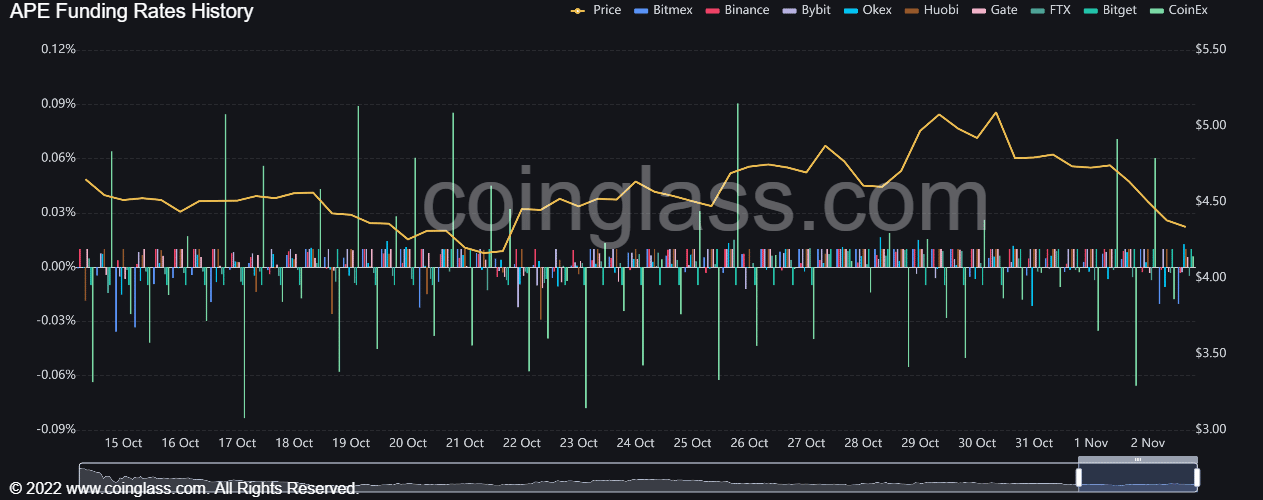
An analysis of APE’s funding rates revealed a slightly deteriorating sentiment in the futures market. On Binance and FTX, its funding rate was still negative and unveiled a slight edge for the sellers.
The buyers should look for a potential uptrend on this front to gauge the underlying investor sentiment before placing any calls. This analysis could aid in identifying a potential bearish invalidation.
Finally, investors/traders should factor in broader market sentiment and on-chain developments to make a profitable move.