Arbitrum vs Polygon: Tokens compete neck-to-neck, but there’s only one winner

- Arbitrum would face enormous resistance at the $1.4 and $1.6 levels, but a breakout could see it enter price discovery.
- Polygon had a firmer bullish bias and presented a good buying opportunity with room for more gains than ARB.
Ethereum’s layer 2 network Arbitrum [ARB] was in an interesting position. Among other things, the weekly Arbitrum report highlighted the milestone achievement of the network’s 300 million transaction mark. On the other hand, there was evidence of a substantial outflow of capital from the ARB market.
Read Arbitrum’s [ARB] Price Prediction 2023-24
Polygon [MATIC] also saw news developments that will likely impact investor sentiment. The one that traders and investors might be most interested in is the proposal by Polygon Labs to replace MATIC with the native token POL. A more in-depth dive can be perused here.
Who has the advantage in the Arbitrum vs Polygon matchup?
On the price action front, both altcoins have a bullish outlook on the higher timeframes. Arbitrum has been in the market for a much shorter duration than Polygon, which made the comparison of some of the on-chain metrics less straightforward. The comparison was clearer on the price charts, and the winner of Arbitrum vs Polygon was likely to be the latter in terms of performance in the coming weeks.
The crypto market as a whole has gained value since mid-June. The Tether Dominance metric fell from 8.53% on 15 June to 6.74% on 13 July, which highlighted capital flow away from the stablecoin and into crypto assets. This was accompanied by the altcoin market cap climbing from $300 billion to $350 billion. Meanwhile, Bitcoin’s [BTC] dominance has also taken a hit in the past three weeks.
It fell from 52.18% on 28 June to 49.74% on 15 July, representing a 4.67% fall. Hence, the fact that MATIC and ARB have had a bullish outlook over the past month was not surprising- this was a market-wide trend.
The overhead resistance was close for ARB while MATIC noted a retracement toward a powerful support level
The 1-day chart of Arbitrum showed that the price action had a bullish structure. This came in mid-June when ARB climbed above the $1.153 mark and flipped the structure bullish. It also established a higher low at $1.06. Over the past five days, ARB has rallied by 21.8%, measured from the low at $1.108 to the high at $1.35.
There was a bearish order block (cyan) at the $1.2 zone, but the daily trading sessions posted candlewicks above this zone in the past three days, underlining a clear bullish intent. But since late May a daily trading session has not closed above this zone. When that happens, the bearish order block would be flipped to a bullish breaker or a support zone.
From there, ARB can form a consolidation base before pushing higher to the $1.4-$1.5 bearish order block (red box) from 21 April. Back then, the inability of ARB to defend the $1.6 zone on the lower timeframes showcased bearish dominance. Therefore, on the way northward, it was very likely that both the highlighted order block as well as the $1.6 level would offer intense resistance to the bullish advances.
It could take time for the buyers to chew their way through the order book likely to be packed with sell orders, but it was possible. The RSI was at the 67 mark at press time, showing firm bullish dominance. Combined with the structure, a move toward $1.4 looked likely. The OBV has seen a slump in July but has begun to push higher over the past three days.
The Fibonacci retracement levels presented a nice buying opportunity for MATIC bulls
The native token of Polygon also has a bullish outlook on the 1-day chart, as we have talked about already. The bullish structure was established when the price moved above the $0.678 mark on 22 June. Since then, MATIC also registered a higher low at $0.6 before rallying further in July.
Based on this rally from $0.6 to $0.8916, a set of Fibonacci retracement levels was drawn. The 50% and 61.8% retracement levels sat at $0.746 and $0.711, with the price just above $0.77 at press time. Therefore, a test of either of these retracement levels would offer a buying opportunity with invalidation below $0.648, the most recent higher low.
To corroborate the bullish findings from the price action chart, the OBV has trended higher since late June. This showed strong buying pressure and steady demand for the token. The RSI was also in bullish territory above neutral 50, signaling upward momentum remained strong.
To the north, the local high at $0.8916 and the 23.6% extension level at $0.96 present targets for the bulls to take profits at. The $0.95-$1.02 region is a higher timeframe resistance zone as well as having confluence with a psychological round-number resistance.
Metrics showed both assets’ holders held unrealized profits

Source: Santiment
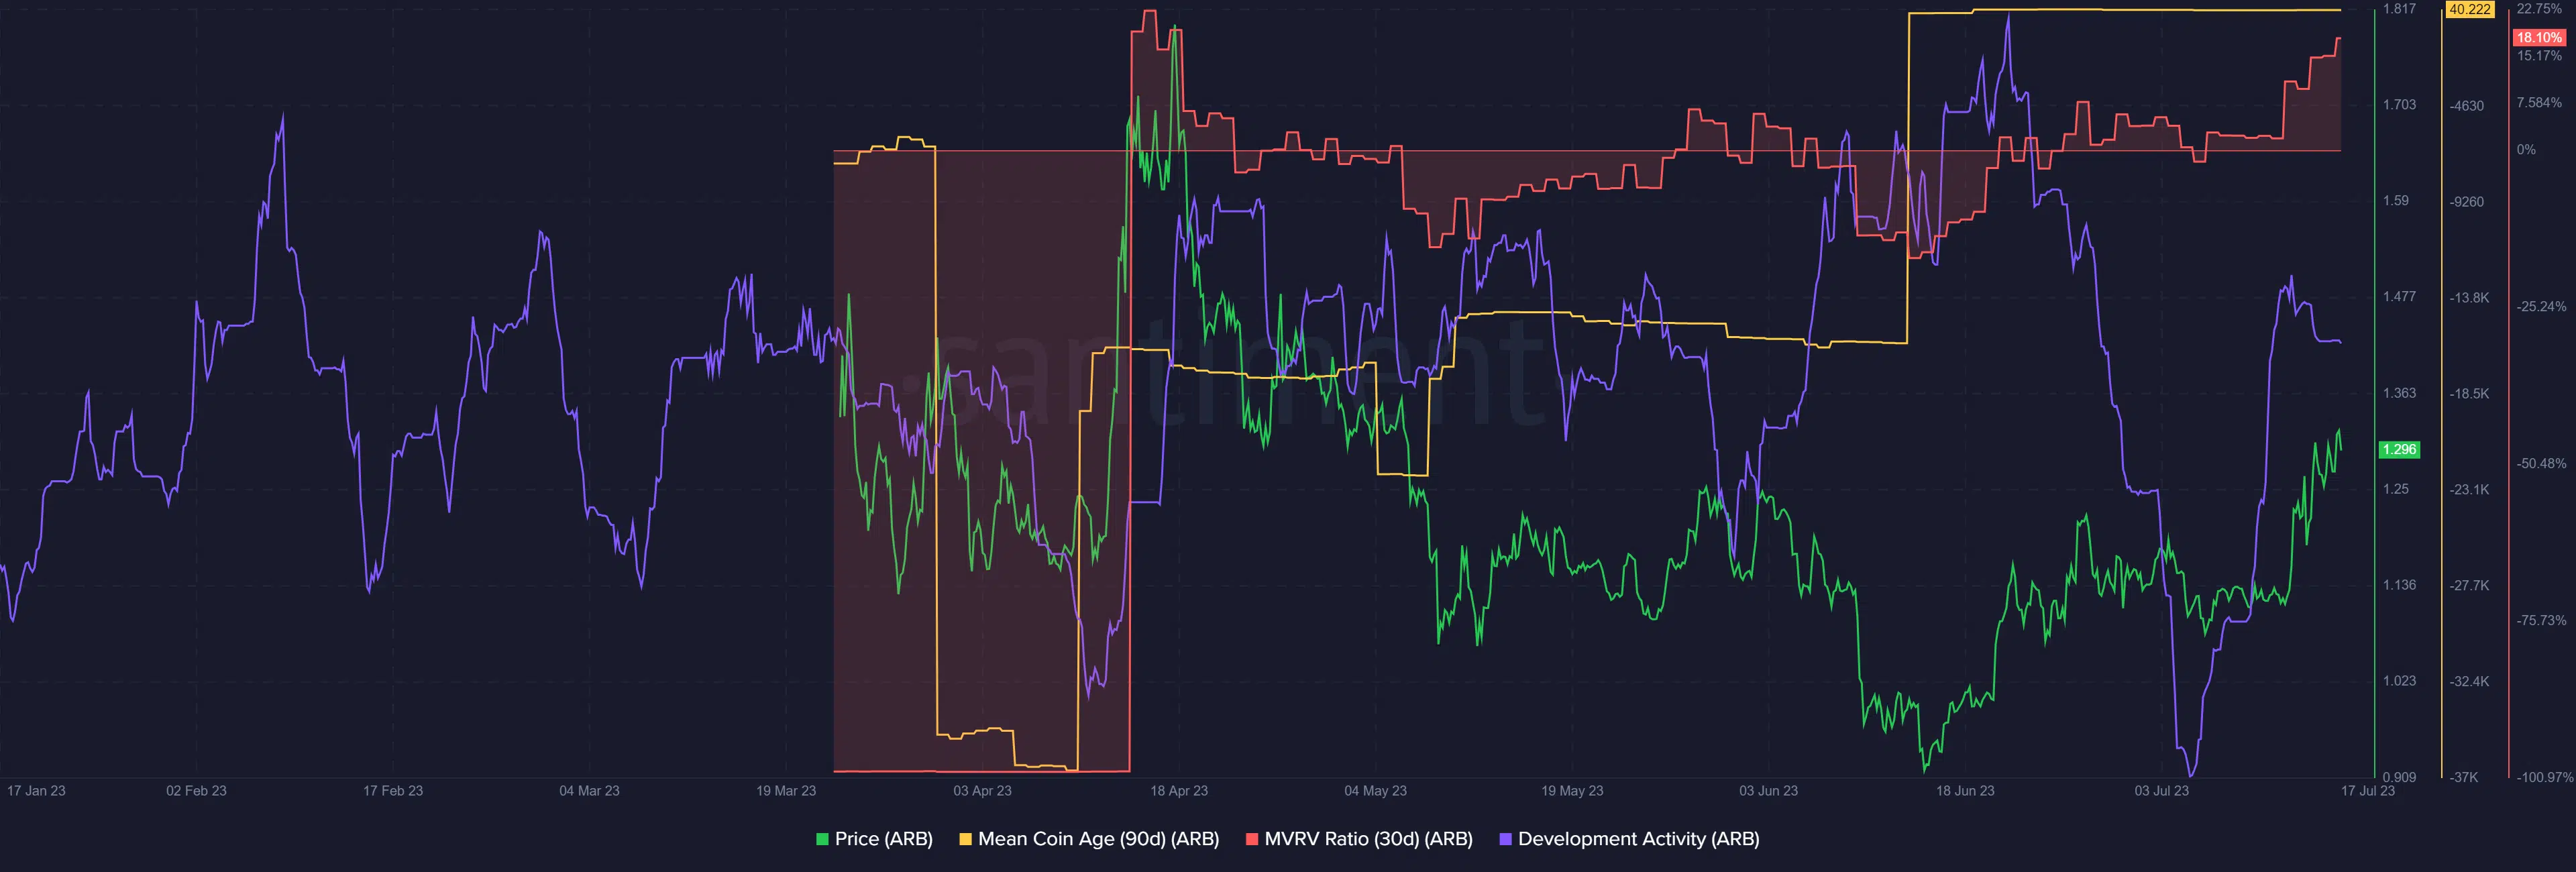
The mean coin age chart has climbed higher in recent weeks for Arbitrum, showing network-wide accumulation. The 30-day MVRV ratio was positive, which showed holders of the token sat on unrealized profits. The value neared the high from 16 April, when a wave of selling hit the market. It was unclear if the same could repeat but buyers must be on their toes.
Meanwhile, the development activity continued without correlation to the price action, which was encouraging for longer-term investors. Overall, the metrics examined showed buyers have had an advantage in recent days.

Source: Santiment
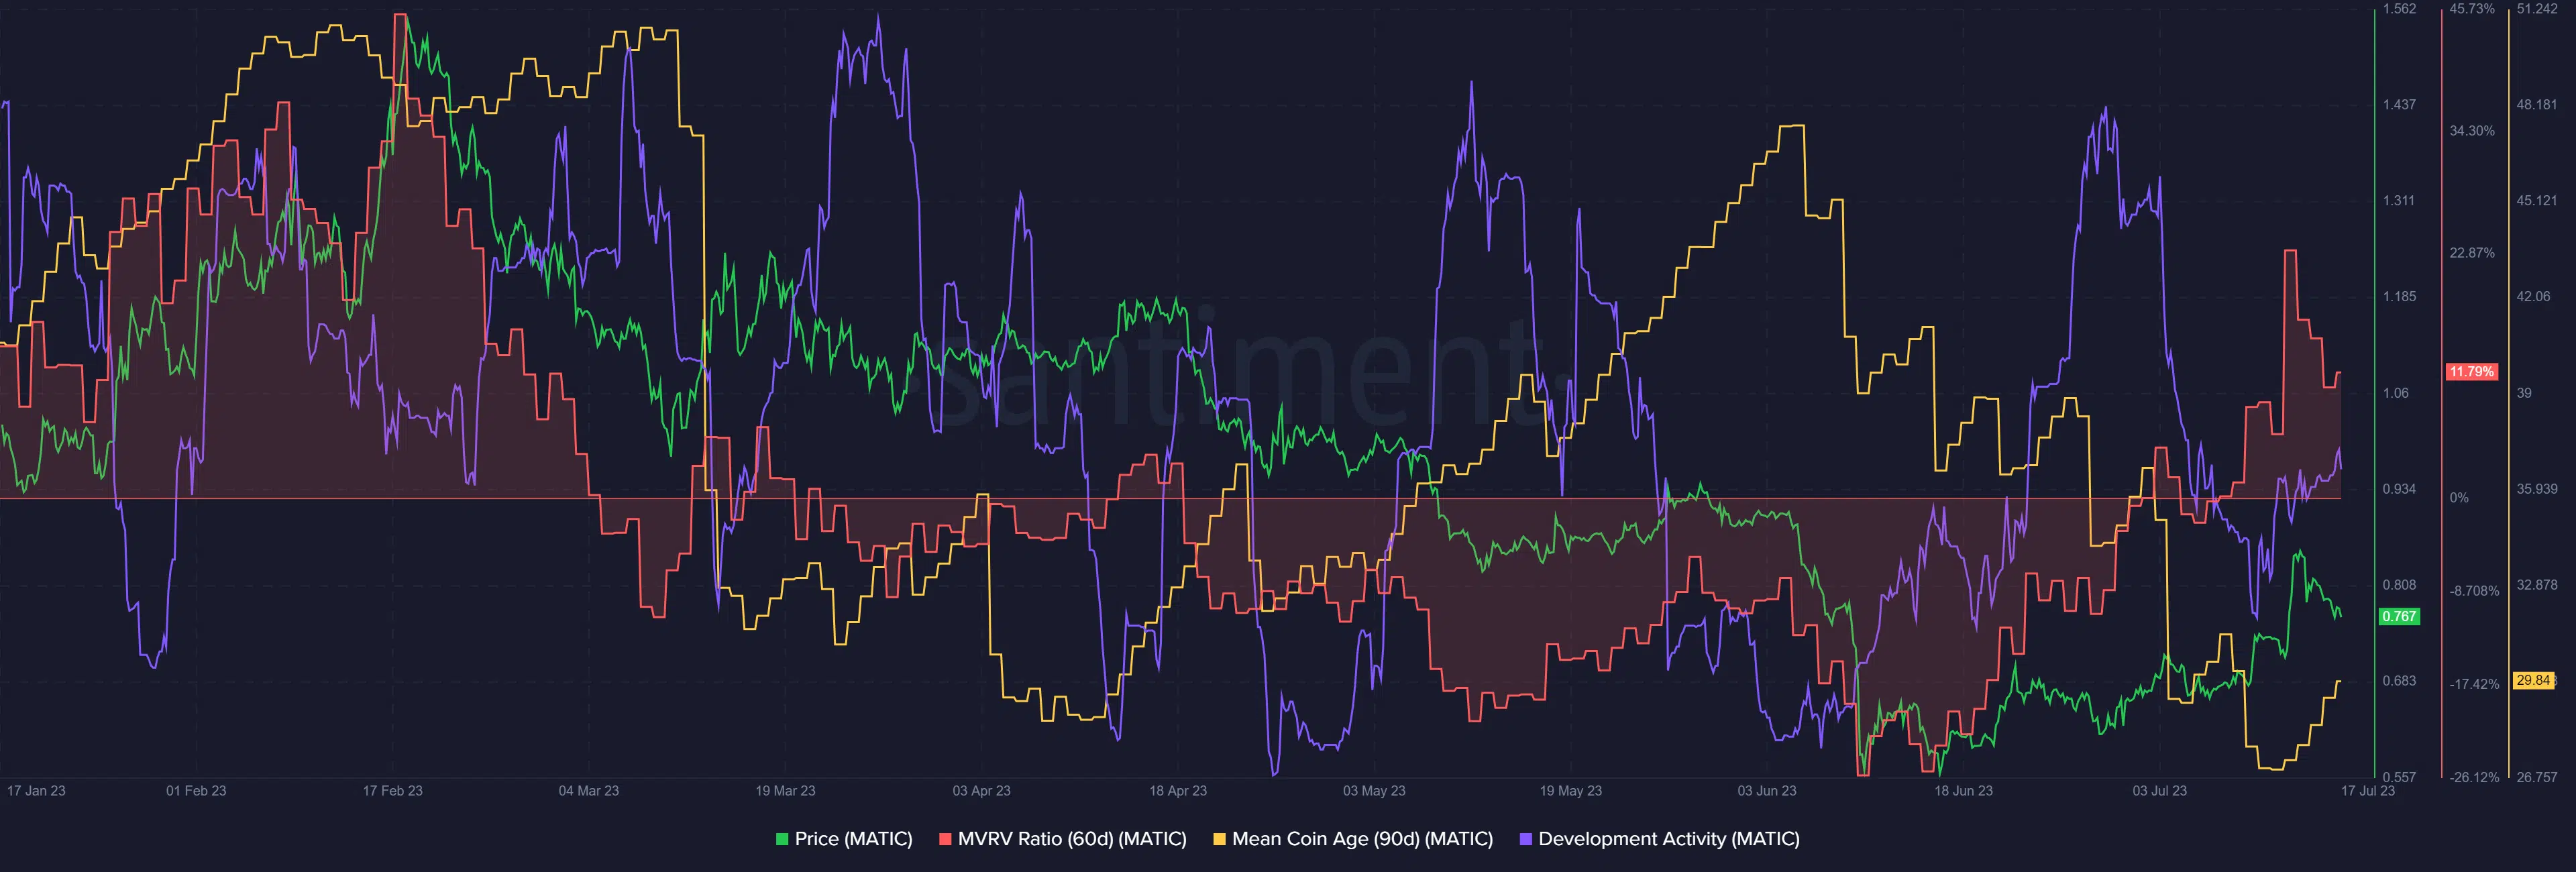
The mean coin age metric of MATIC showed that sellers were dominant in the market, and accumulation was not underway. This has been the case since early June, although the past few days saw a bounce in this metric. Overall, the finding weakened the bullish case of MATIC.
Is your portfolio green? Check the Polygon Profit Calculator
The MVRV ratio climbed toward the highs from mid-February. The closer it gets the more wary buyers must be of the selling pressure that can come from profit-taking. On the other hand, the development activity continued to move as it has throughout 2023, showing investors progress was being made.
Amongst the two, MATIC had a clearer bullish bias and more room for gains than ARB, based on the price charts. Yet, if ARB can breakout past the $1.6 region, the resistance overhead would dramatically weaken, and it could even enter price discovery once more. Longer-term bulls should also be watchful of the points on the chart where their bullish thesis get invalidated.


