As ApeCoin breaks out of a range, can it push toward $20

Disclaimer: The findings of the following analysis are the sole opinions of the writer and should not be considered investment advice
Bitcoin faced strong selling pressure around the $42.8k area, and another wave of fear rippled across the crypto market. This was not the case for ApeCoin, which occupied the 30th spot on CoinMarketCap, ranked by market capitalization. There was heavy demand and momentum was with the bulls. How far could ApeCoin climb?
APE- 12 Hour Chart
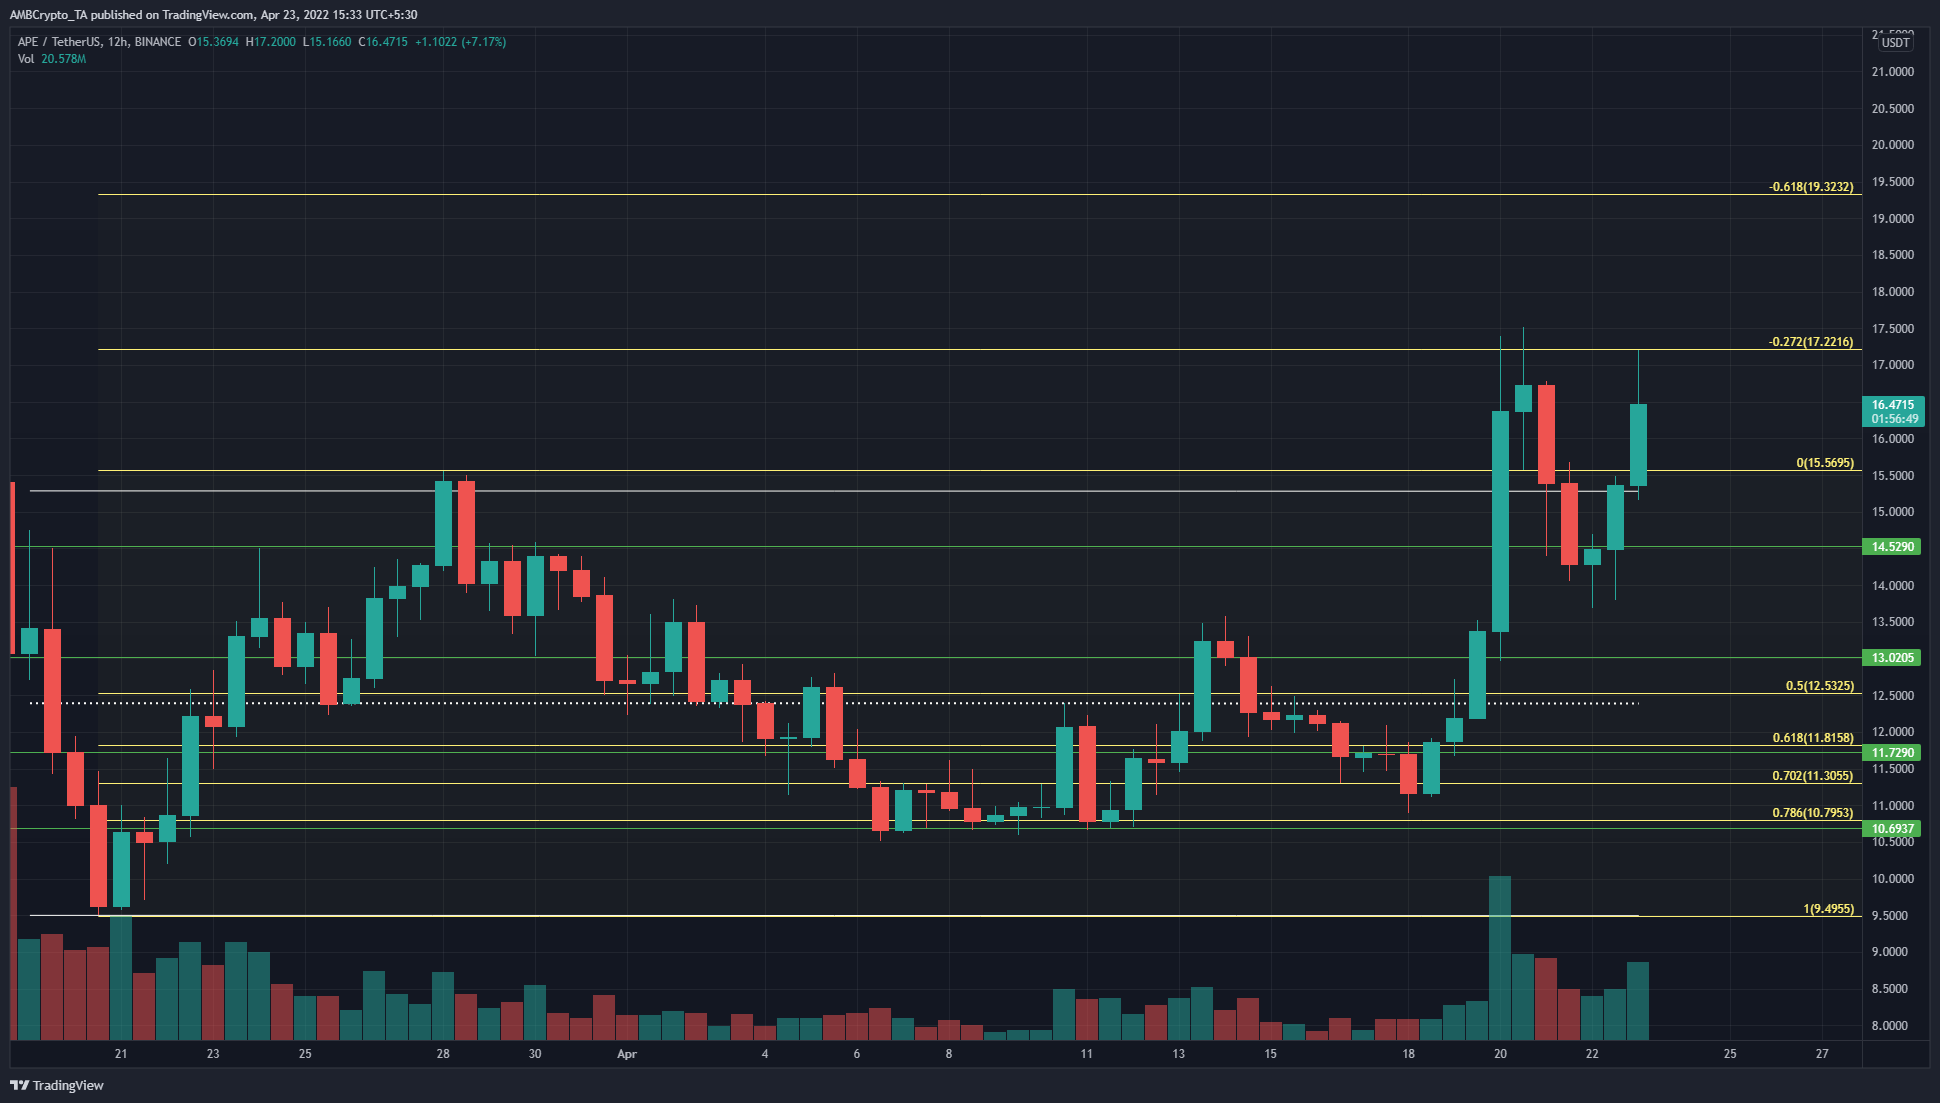
The market structure of APE on the larger timeframes was strongly bullish. The former highs at $15.56 have been broken in the past few days, and at the same time, the price has formed higher lows in the past month.
The price had formed a range between $9.5 and $15.3 (gray) and the price had broken past the range highs and retested the $14.5 support as well. This suggested that further highs were likely around the corner.
Using Fibonacci retracement and extension levels (yellow) for APE’s move from $9.5 to $15.56, the 27.2% and 61.8% extension levels were plotted at $17.22 and $19.32. It was likely that APE bulls would drive prices toward these levels and possibly higher as well.
Rationale
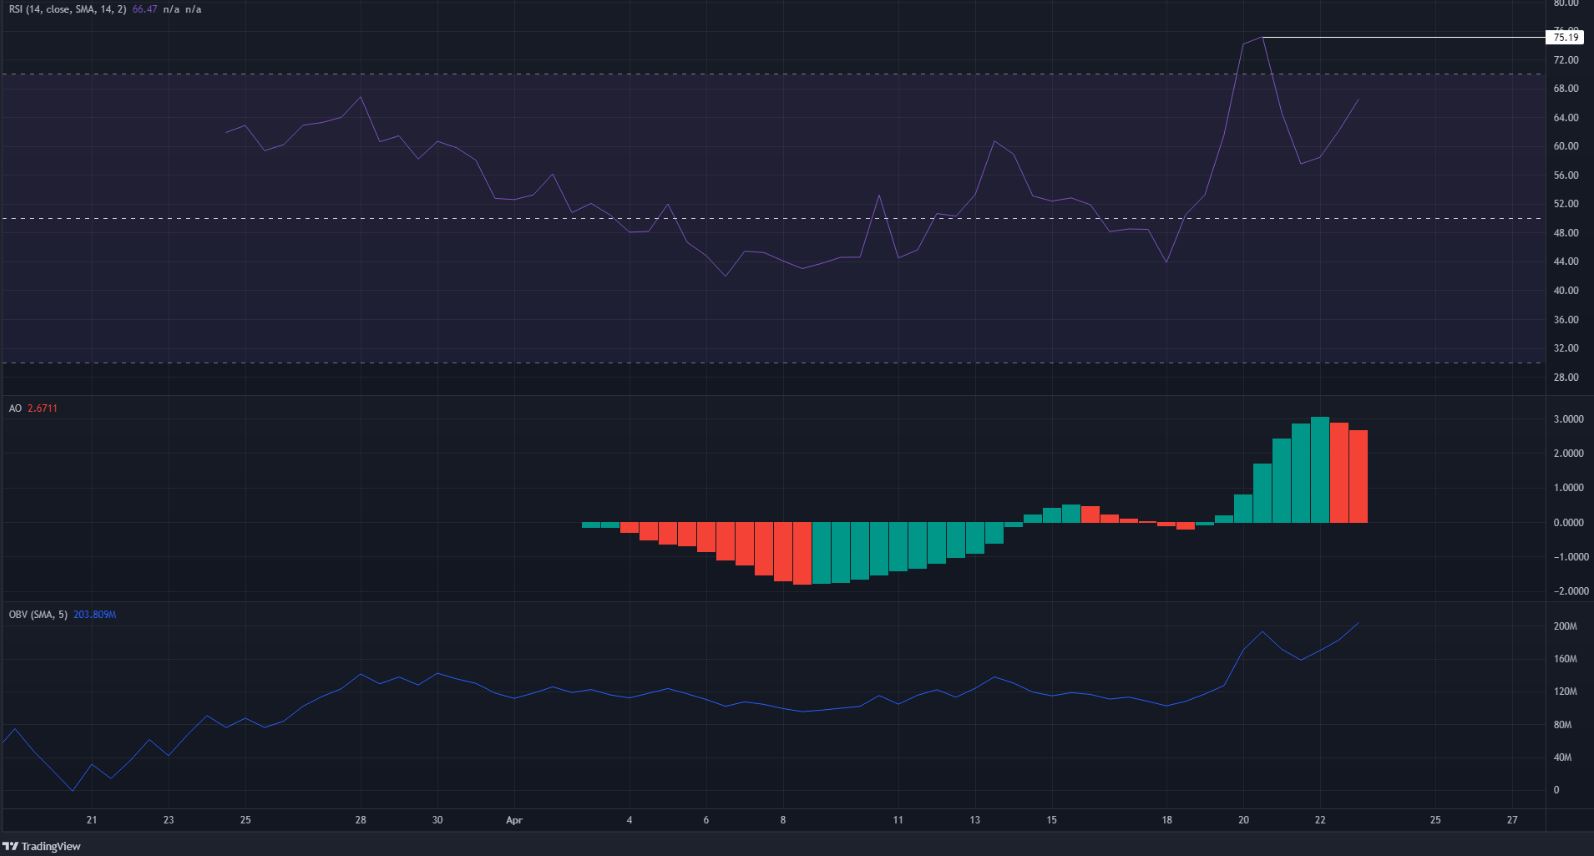
The RSI on the 12-hour chart posted a high of 75.19 and has dipped to just below 60 as APE pulled back from $16.72 to $14.28. As the price tried to push higher again, there is a chance that the price would push higher while the RSI was unable to, over the next few trading sessions.
This could see APE exhibit a bearish divergence between price and momentum and could see another pullback for APE.
The Awesome Oscillator was well above to zero line to show that momentum remained with the bulls. The OBV was also on an uptrend in the past month, showing steady demand from buyers.
Conclusion
The indicators showed strong bullish momentum and good demand behind APE’s rising prices in the past week. While there is a chance of a bearish divergence materializing, it was still likely that APE would push higher toward the $19-$20 area.