Analyzing weekly performance of Decentraland [MANA], and SAND
![Analyzing weekly performance of Decentraland [MANA], and SAND](https://ambcrypto.com/wp-content/uploads/2023/03/AMBCrypto_metaverse_516b3910-7ab1-4e40-a9e6-7626567da6ac.jpg)
- MANA and SAND recorded double-digit price rallies in the last week.
- MANA currently exhibits a CMF/price divergence that hints at a price drawback.
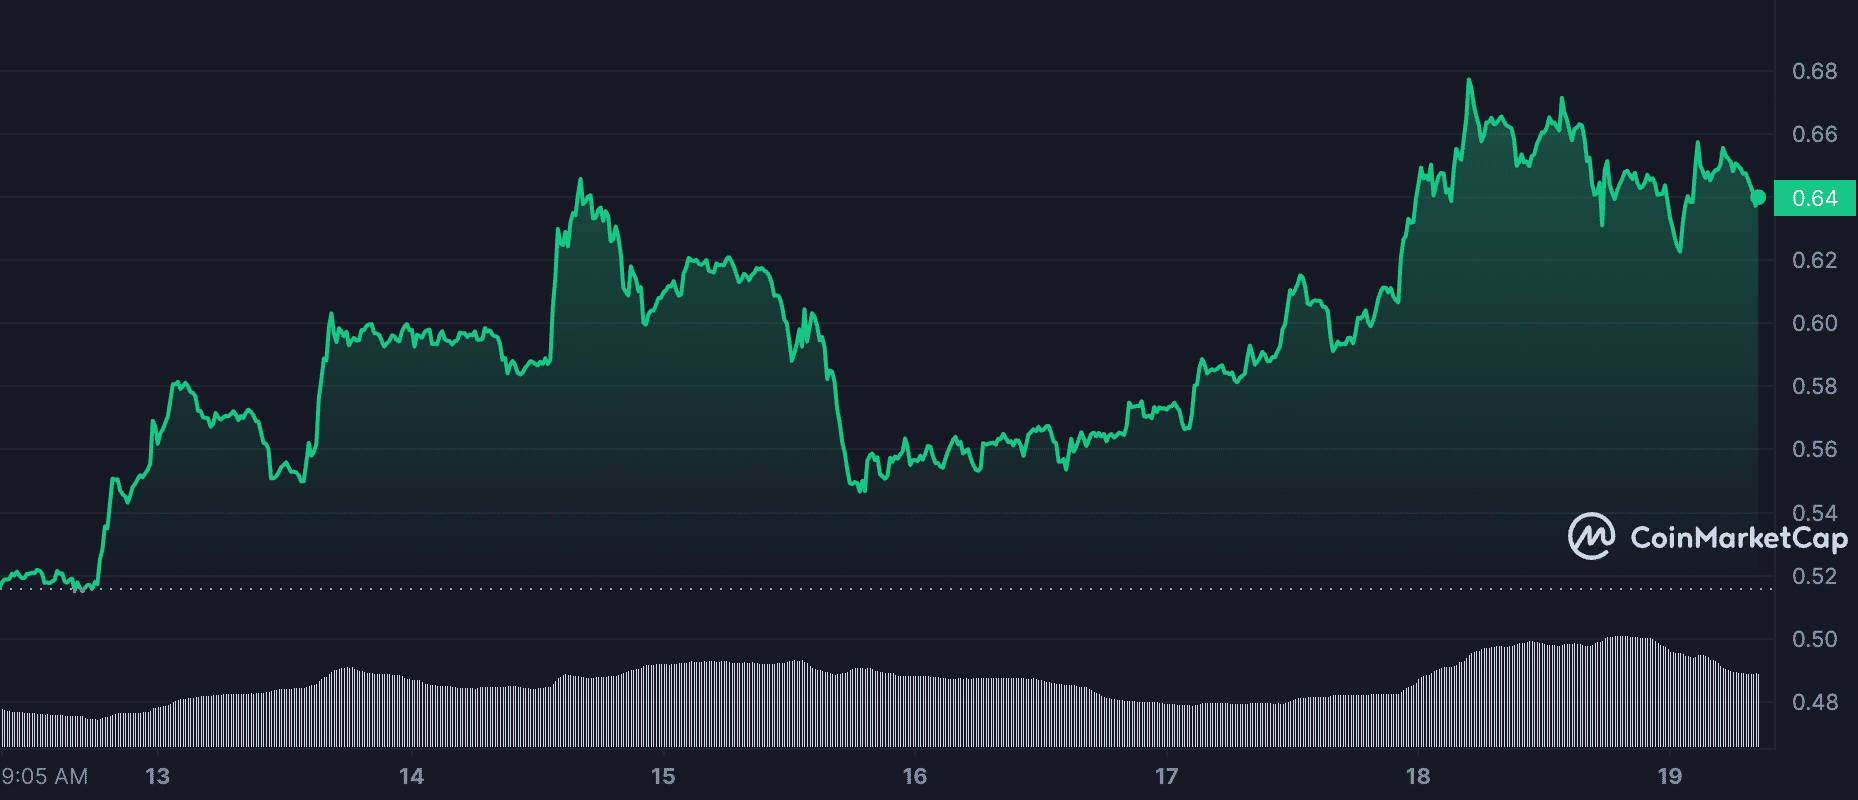
Following last weekend’s market-wide decline in price for several crypto assets, leading metaverse tokens Decentraland [MANA] and The SandBox [SAND] were amongst the best performers in the week. Per data from CoinMarketCap, both assets recorded double-digit gains in the last seven days.
Decentraland and The SandBox saw increased user activity
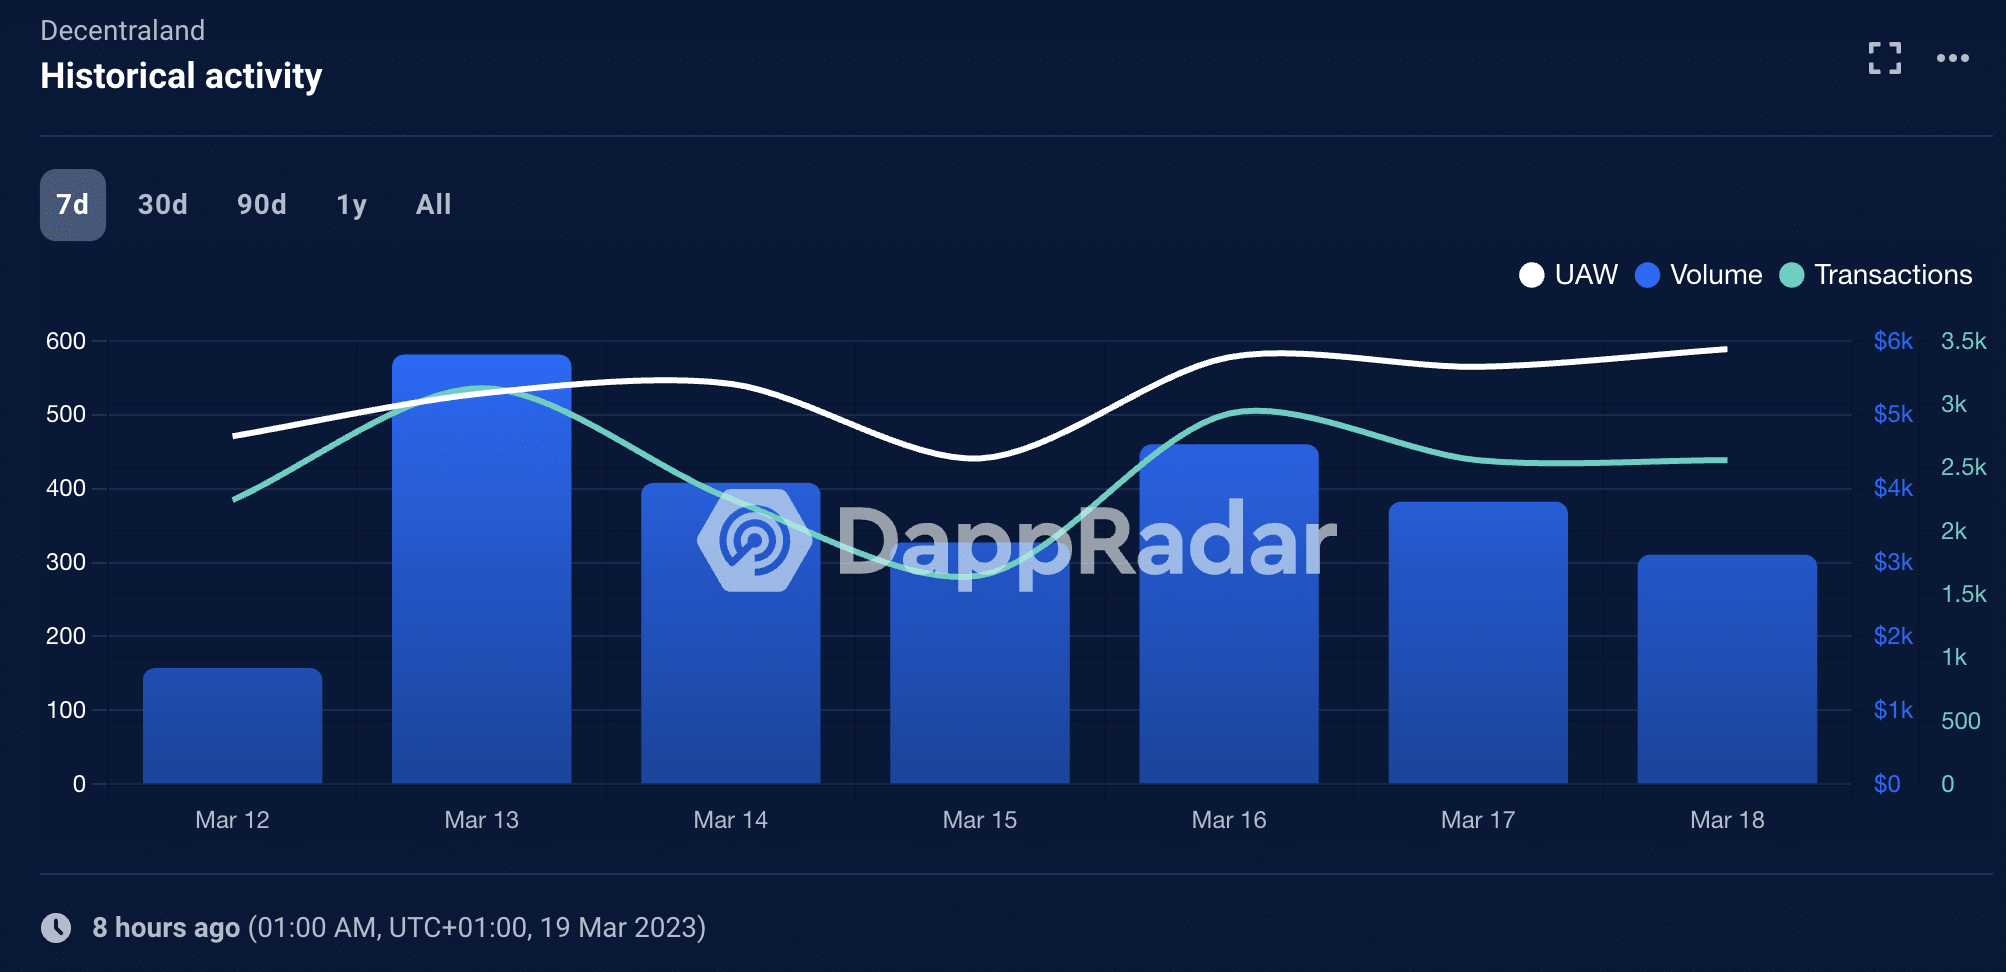
According to data from DappRadar, Decentraland and The SandBox both recorded hikes in user activity, albeit of varying degrees. In the last seven days, Decentraland recorded a 14.15% hike in the count of unique active wallets that interacted with the metaverse-based project.
This resulted in a corresponding rally in the total number of transactions made between these unique active wallets and Decentraland’s smart contracts. Data from DappRadar also showed that 17,450 transactions were completed in the last week, representing a 26.08% increase in transactions count.
Read Decentraland [MANA] Price Prediction 2023-24
Further, as the count of transactions completed by unique active users on Decentraland grew in the last week, the fiat value of these transactions also went up by 131%. This culminated in a 25% growth in the value of assets locked within the Decentraland ecosystem. Per DappRadar, this was $23.4 million at press time.
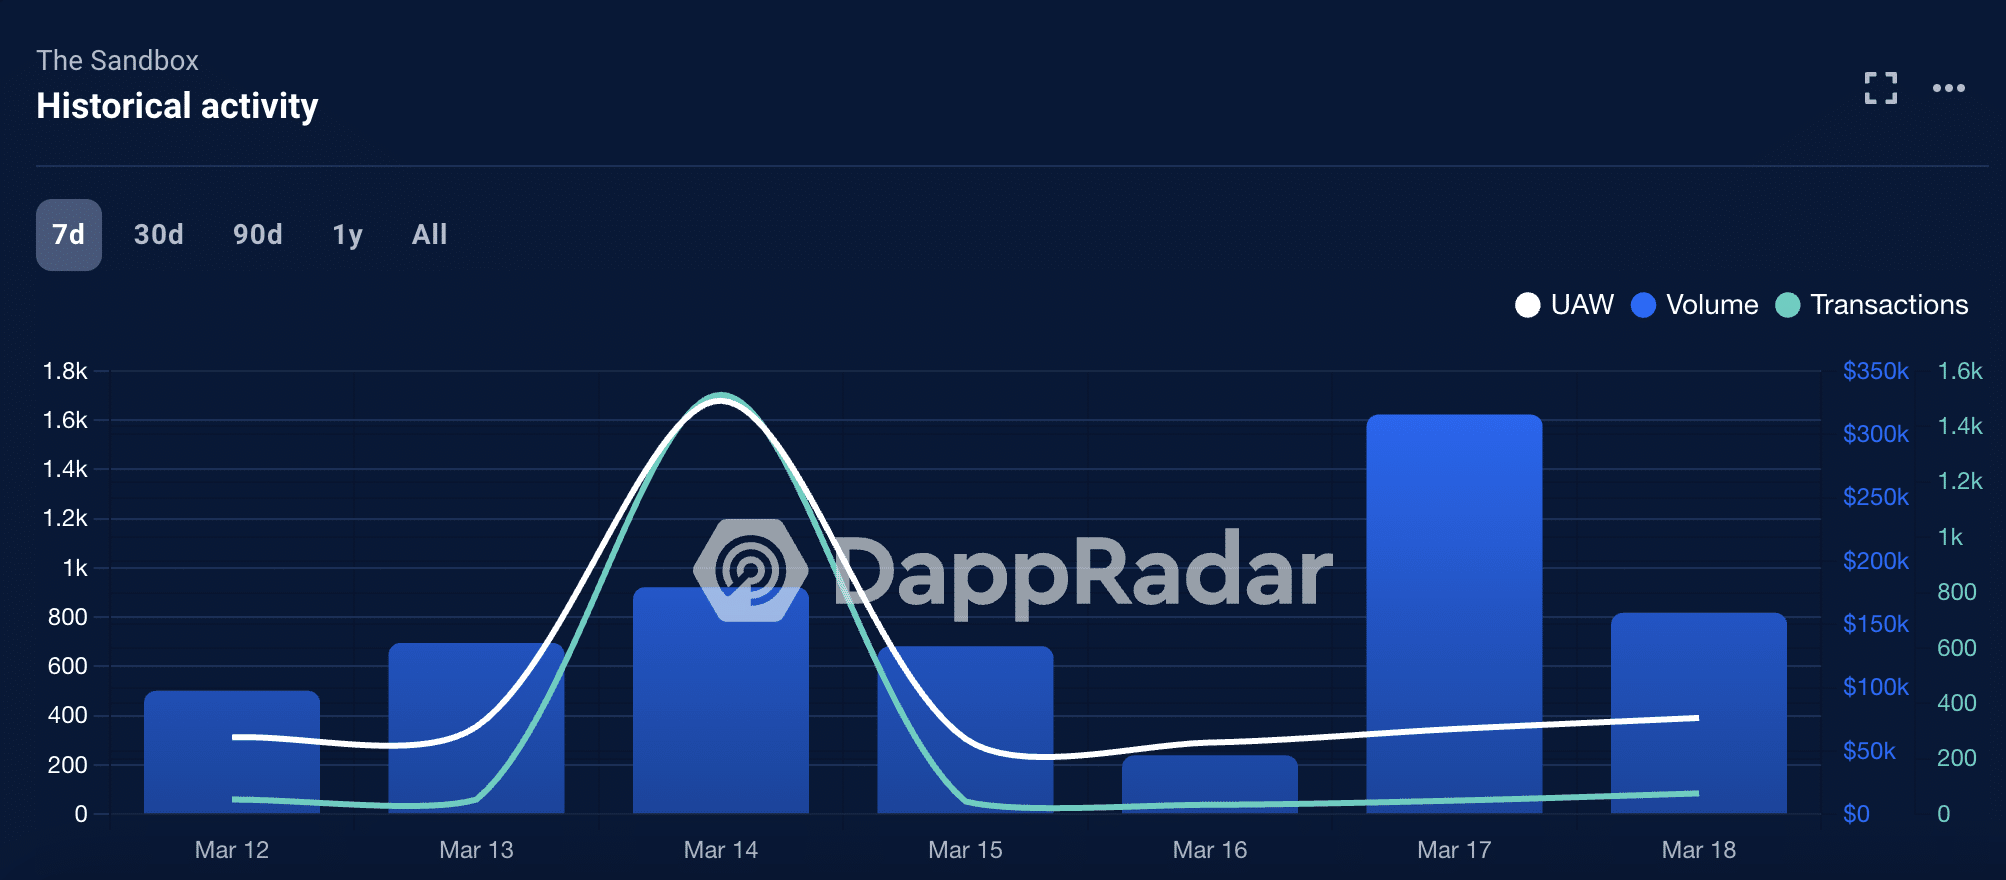
The SandBox, on the other hand, did not record the same level of growth. Within the period under review, the count of unique active wallets that interacted with the metaverse-based gaming project grew by a mere 4%.
With minor user activity in the last week, transactions count on The SandBox fell by 6%. Also, the fiat value of transactions completed on the project went up by just 1%.
Interestingly, the tiny subset of active users on the protocol initiated a 155% jump in the value of assets housed within The SandBox in just seven days, data from DappRadar showed.
Read The Sandbox [SAND] Price Prediction 2023-24
MANA’s 30% jump puts it ahead, but here’s the caveat
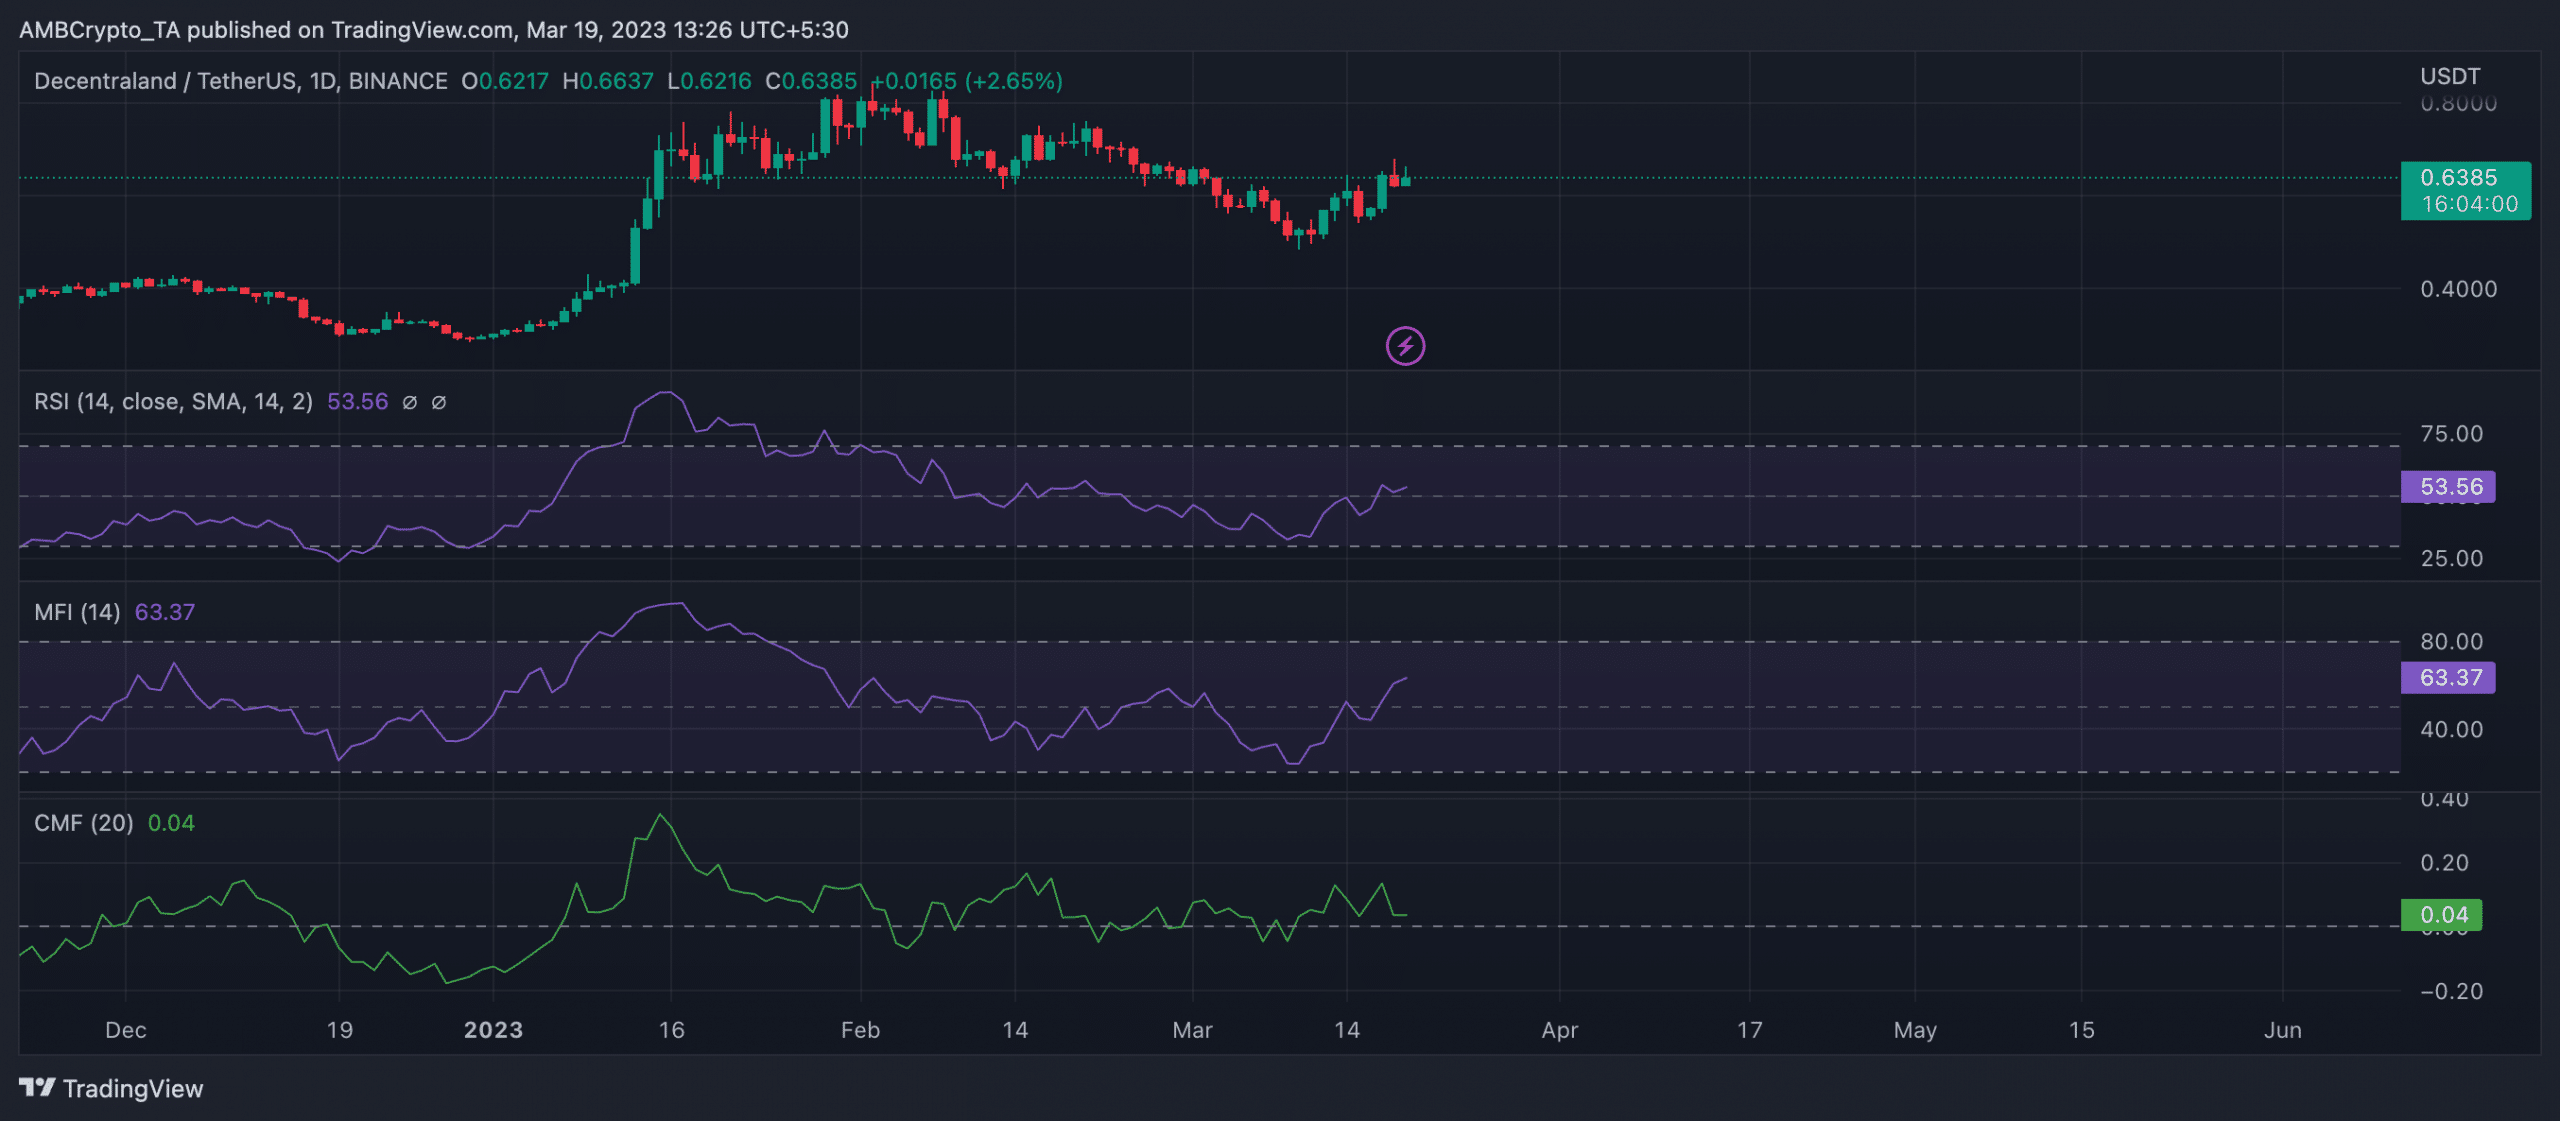
Exchanging hands at $0.6392 at press time, MANA’s value jumped by 30% in the last seven days, data from CoinMarketCap revealed.
An assessment of MANA’s movement on a daily chart showed a corresponding rally in buying pressure during that period. As a result, the asset’s key momentum indicators RSI and MFI, embarked on an uptrend and crossed their respective centerlines. As of this writing, the RSI was at 53.56, while the MFI remained pegged at 63.37.
However, while the buying momentum might exceed selling pressure, a divergence between MANA’s Chaikin Money Flow (CMF) and its MFI has existed in the past two days. While MANA’s price grew, the CMF initiated a downtrend.
When an asset’s price rallies while its CMF dwindles, it often suggests that the buying pressure in the market is decreasing, even though the price is still increasing. This could be a warning sign that the uptrend may not be sustainable, and a potential reversal or correction could occur.