Assessing Ethena’s [ENA] recent gains – Can a bigger breakout follow?
ENA rebounded from the $0.34 support level, but still requires a break above $0.5.
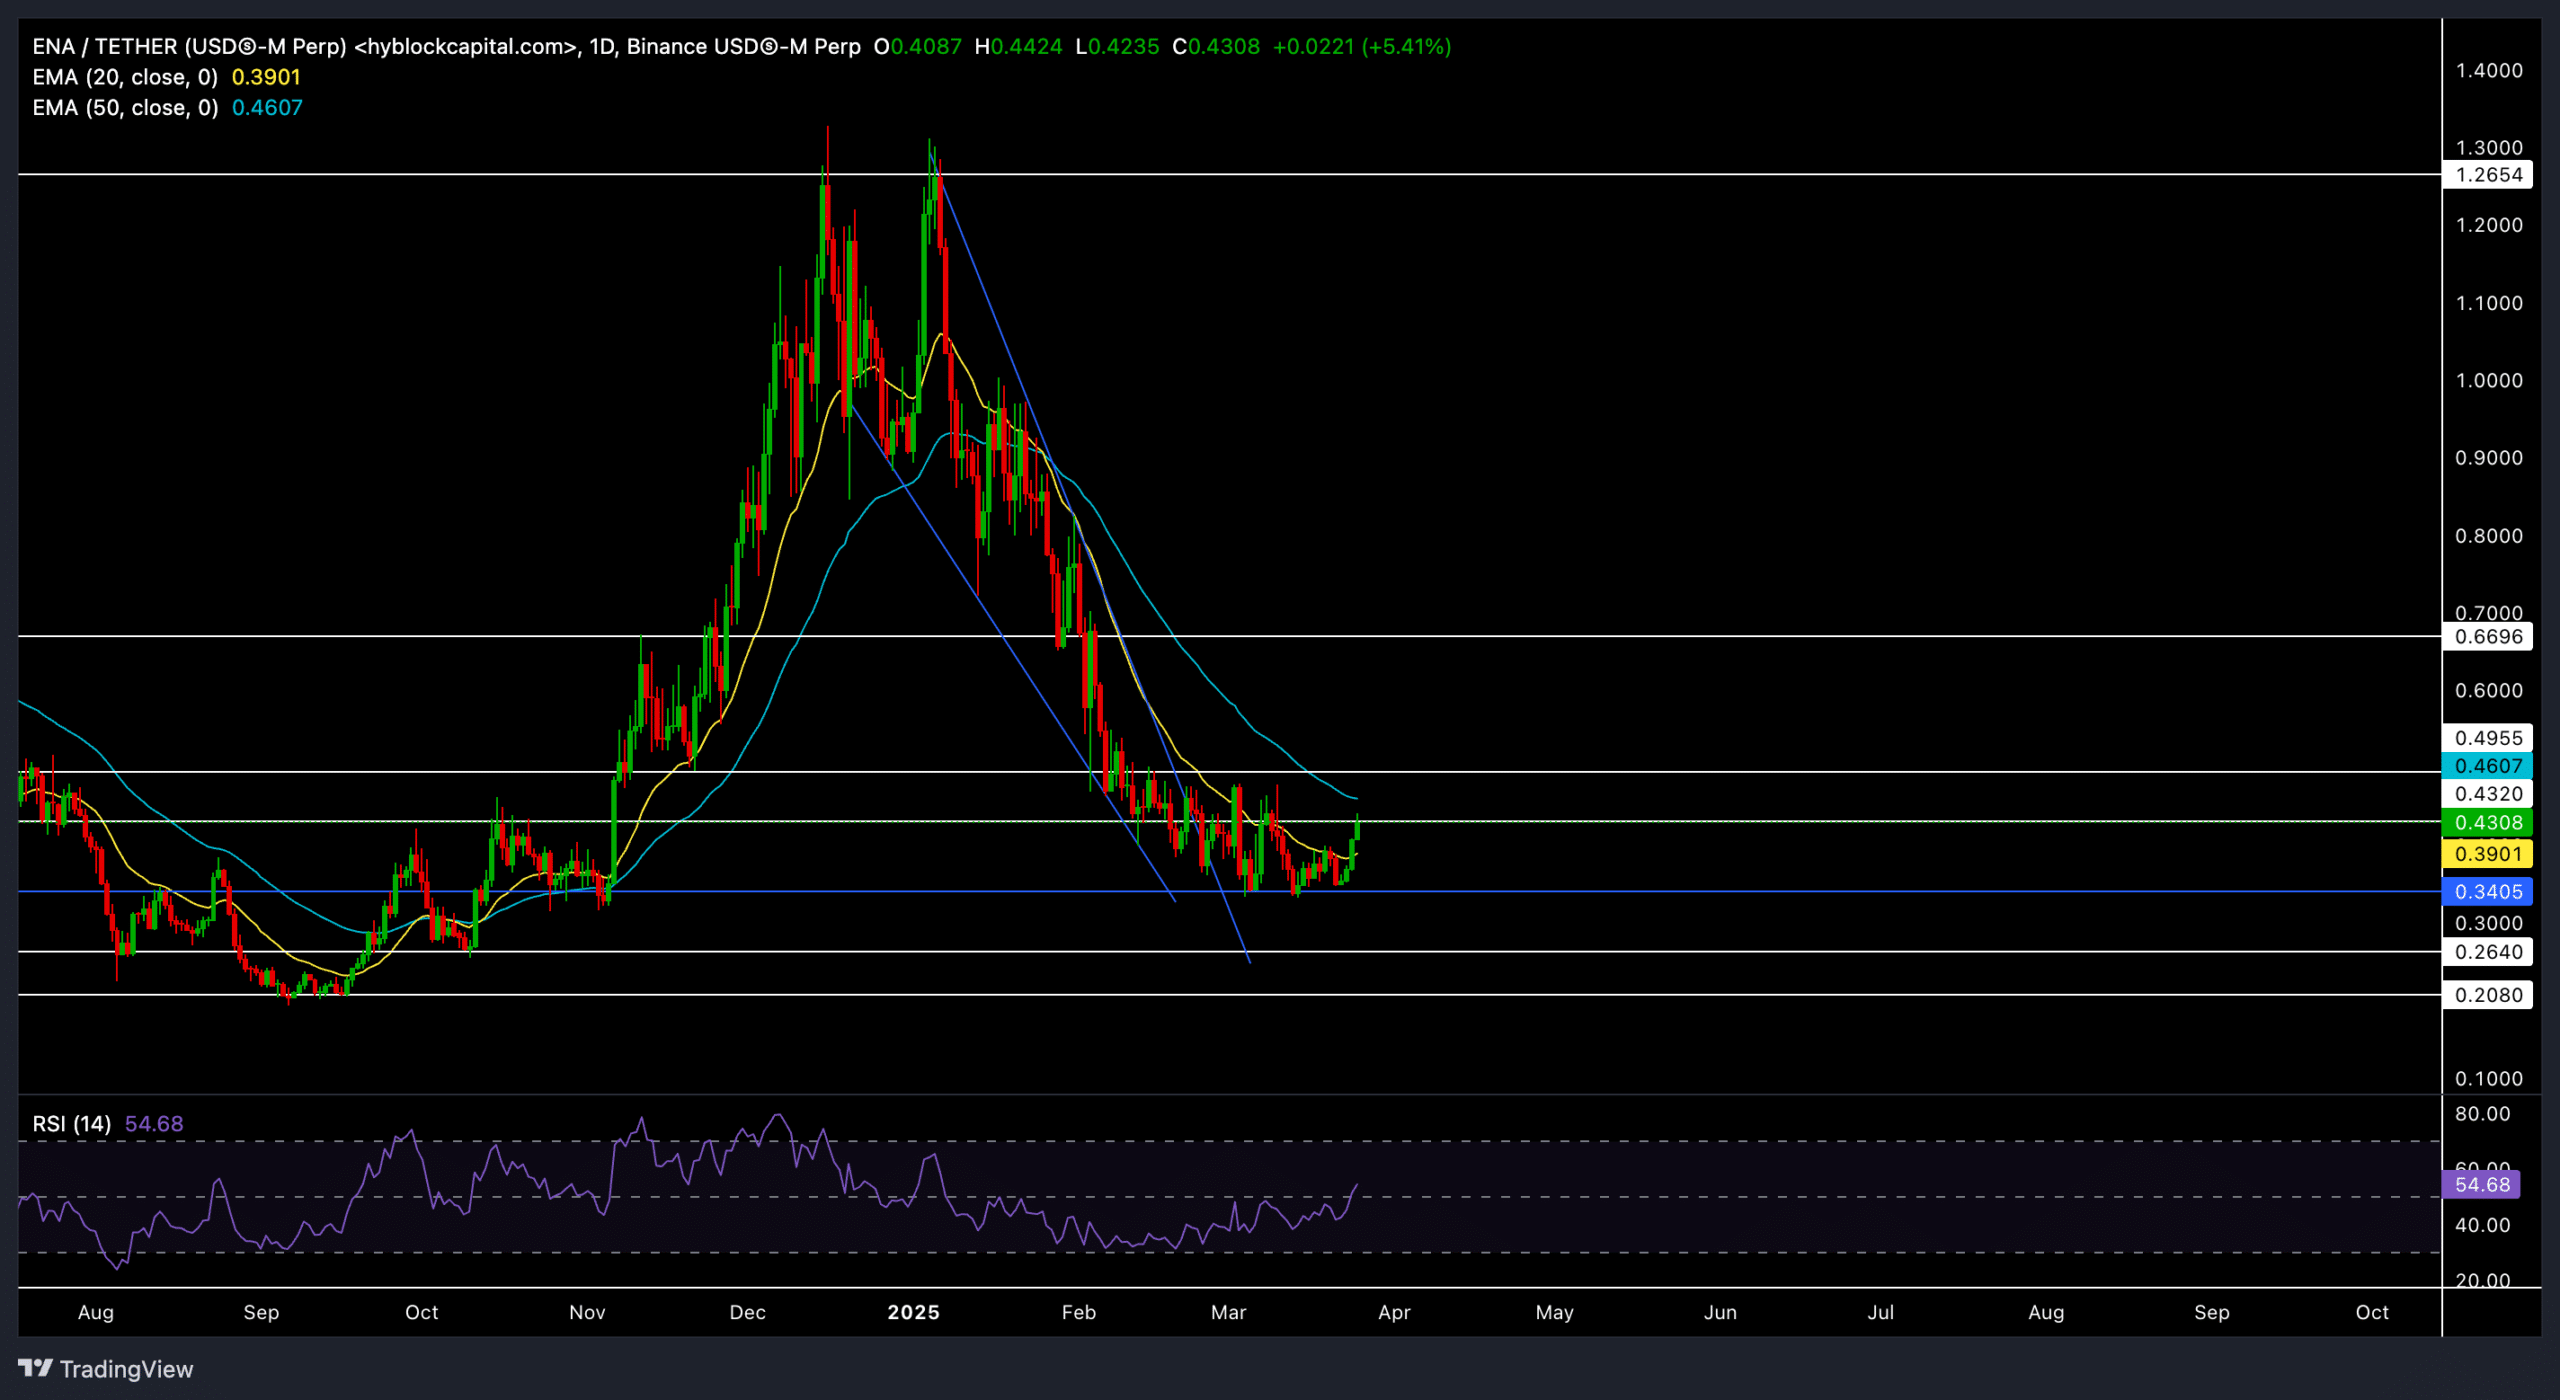
![Assessing Ethena’s [ENA] recent gains – Can a bigger breakout follow?](https://ambcrypto.com/wp-content/uploads/2025/03/ENA-1.webp)
- Recovery above the 20 EMA revealed marginal bullish strength, but the 50 EMA level of $0.46 will continue to pose as key resistance
- Derivatives data showed short positions retreating as Open Interest and volumes spiked
Ethena [ENA] has bounced back from its multi-month lows near the $0.26-$0.28 range, registering an impressive rally that pulled its price above the 20 EMA.
However, the altcoin is still struggling to flip its 50 EMA. This could be a crucial level for ENA’s next definitive move.
Is a strong reversal possible?
Following a parabolic rally towards the $1.2-resistance level, ENA has fallen into a strong downtrend and has consistently set lower highs since. In the meantime, the altcoin formed a classic falling wedge on the daily chart.
However, ENA’s latest bounce from the range-low support at $0.34 set the stage for a structural break. The close of recent daily candles above the 20 EMA ($0.39) and the falling wedge structure hinted at bullish momentum, at least in the near term.
A daily close above $0.5 would expose ENA to more upside gains towards the $0.66–$0.7 zone. On the other hand, failure to move past $0.46–$0.5 could help bears retest the $0.34–$0.35 support zone.
The daily relative strength index (RSI) was around 55 (in the bullish zone) for the first time since January. A potential jump above the 60-level could increase the probability of a stronger bullish trend.
Here, it’s worth noting that the RSI’s movements have bearishly diverged from the price action over the last few days. While this could hint at slower gains, buyers should ensure the RSI’s position is above 50 before opening a long position.
Derivates data revealed THIS

Derivatives data highlighted a bullish divergence. According to Coinglass, ENA’s Open Interest registered an uptick of nearly 15%, alongside a 20% hike in volume.
Climbing OI and volume indicate rising market participation and could drive more volatility. Meanwhile, funding rates, which were long negative for weeks, eased towards the neutral zone. This hinted at fewer aggressive shorts, which could fuel a bigger breakout if buyers hold their ground.
Moreover, the Long/Short Ratio on Binance was near 1.5 for regular accounts and over 2 for top traders – Indicating that more traders are skewed towards long positions.
Should ENA see a breakout above $0.5, late shorts may end up short-squeezing each other and create further upside volatility.
However, traders should also monitor Bitcoin’s movements before opening any positions.