Assessing if Chainlink’s [LINK] recent price action is too good to last

Disclaimer: The findings of the following analysis are the sole opinions of the writer and should not be considered investment advice
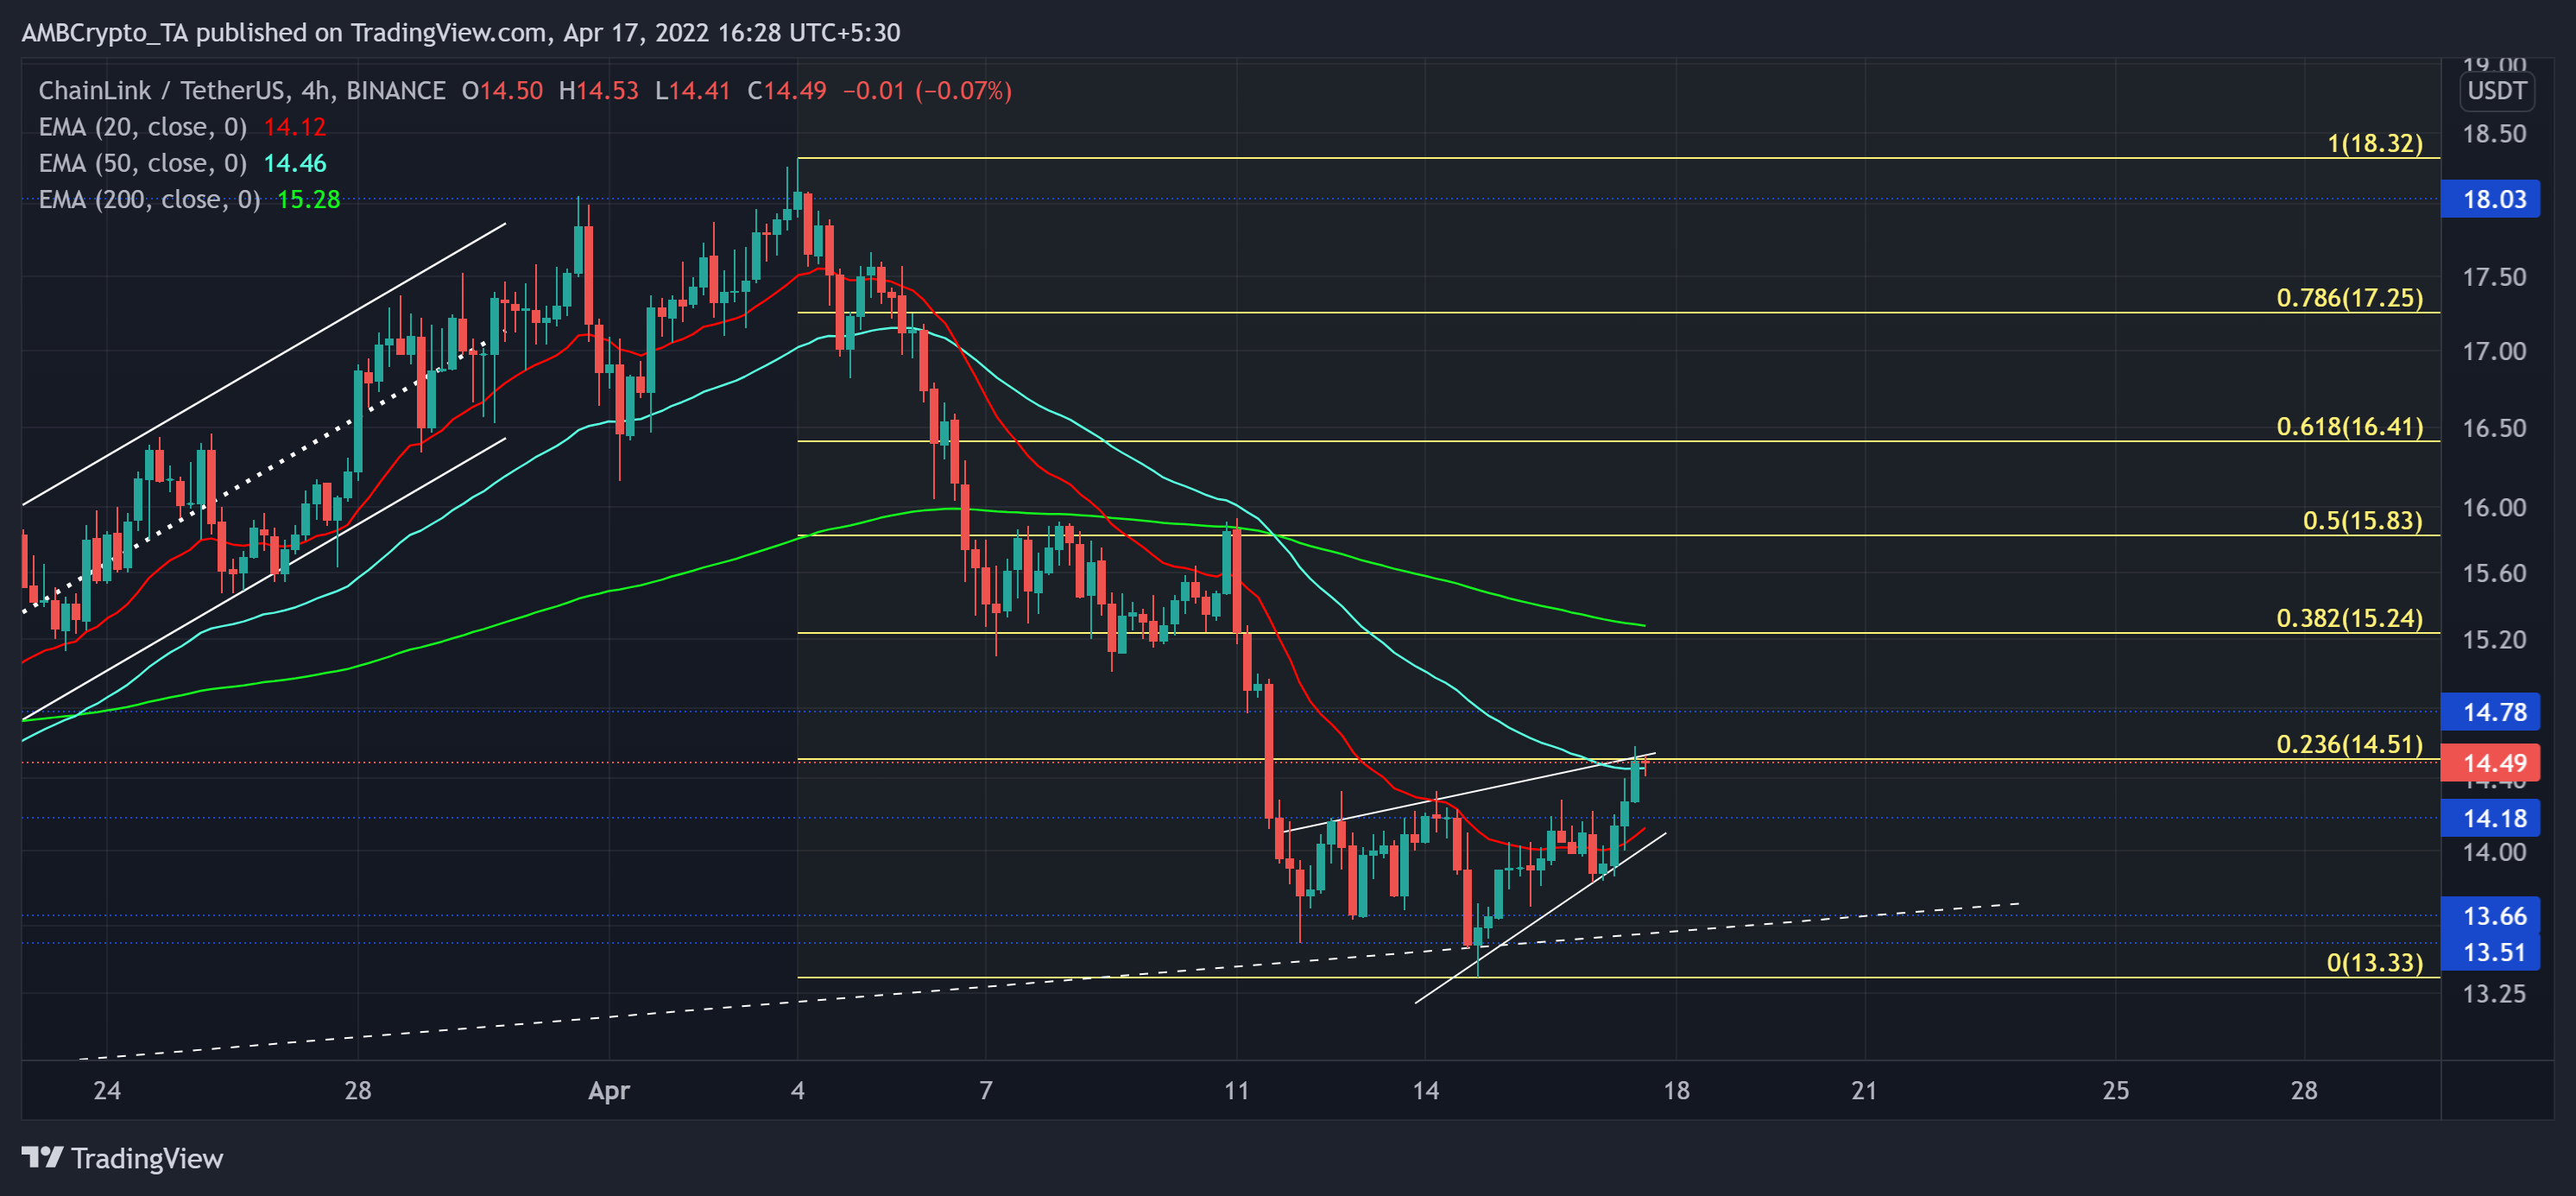
Since matching its monthly low following its most recent plummet, Chainlink (LINK) was back to registering gains after bouncing back from its trendline and horizontal support at the $13.5-level.
A close below the 23.6% Fibonacci resistance could propel a potential retest of the $14.18-mark before a potential breakout. At press time, LINK was trading at $14.49, up by 2.67% in the last 24 hours.
LINK 4-hour chart
As the $11.7-level support has historically (for over a year) served as a strong buying zone, LINK bounced back from its February lows to mark a bullish trendline support (white, dashed).
Soon after, this recovery was shunned by the $18-resistance. Post this, the sell-off phase prevailed whilst the bulls finally stepped foot into the $13-zone.
Now, in order to continue towards a potential 200 EMA (green) retest, LINK would need to break convincingly above the $14-mark and on strong volumes.
If the buyers continue to display their adamance, the alt’s rally could find a compelling close above the 23.6% level. In such a case, the $14-$15 range would pose barriers apart from the threats of its rising wedge breakout. On the flip side, a failure to overturn the 23.6%resistance could cause an immediate retest of the $14.1-mark before the bulls re-attempt to break the shackles of the 50 EMA (cyan).
Rationale
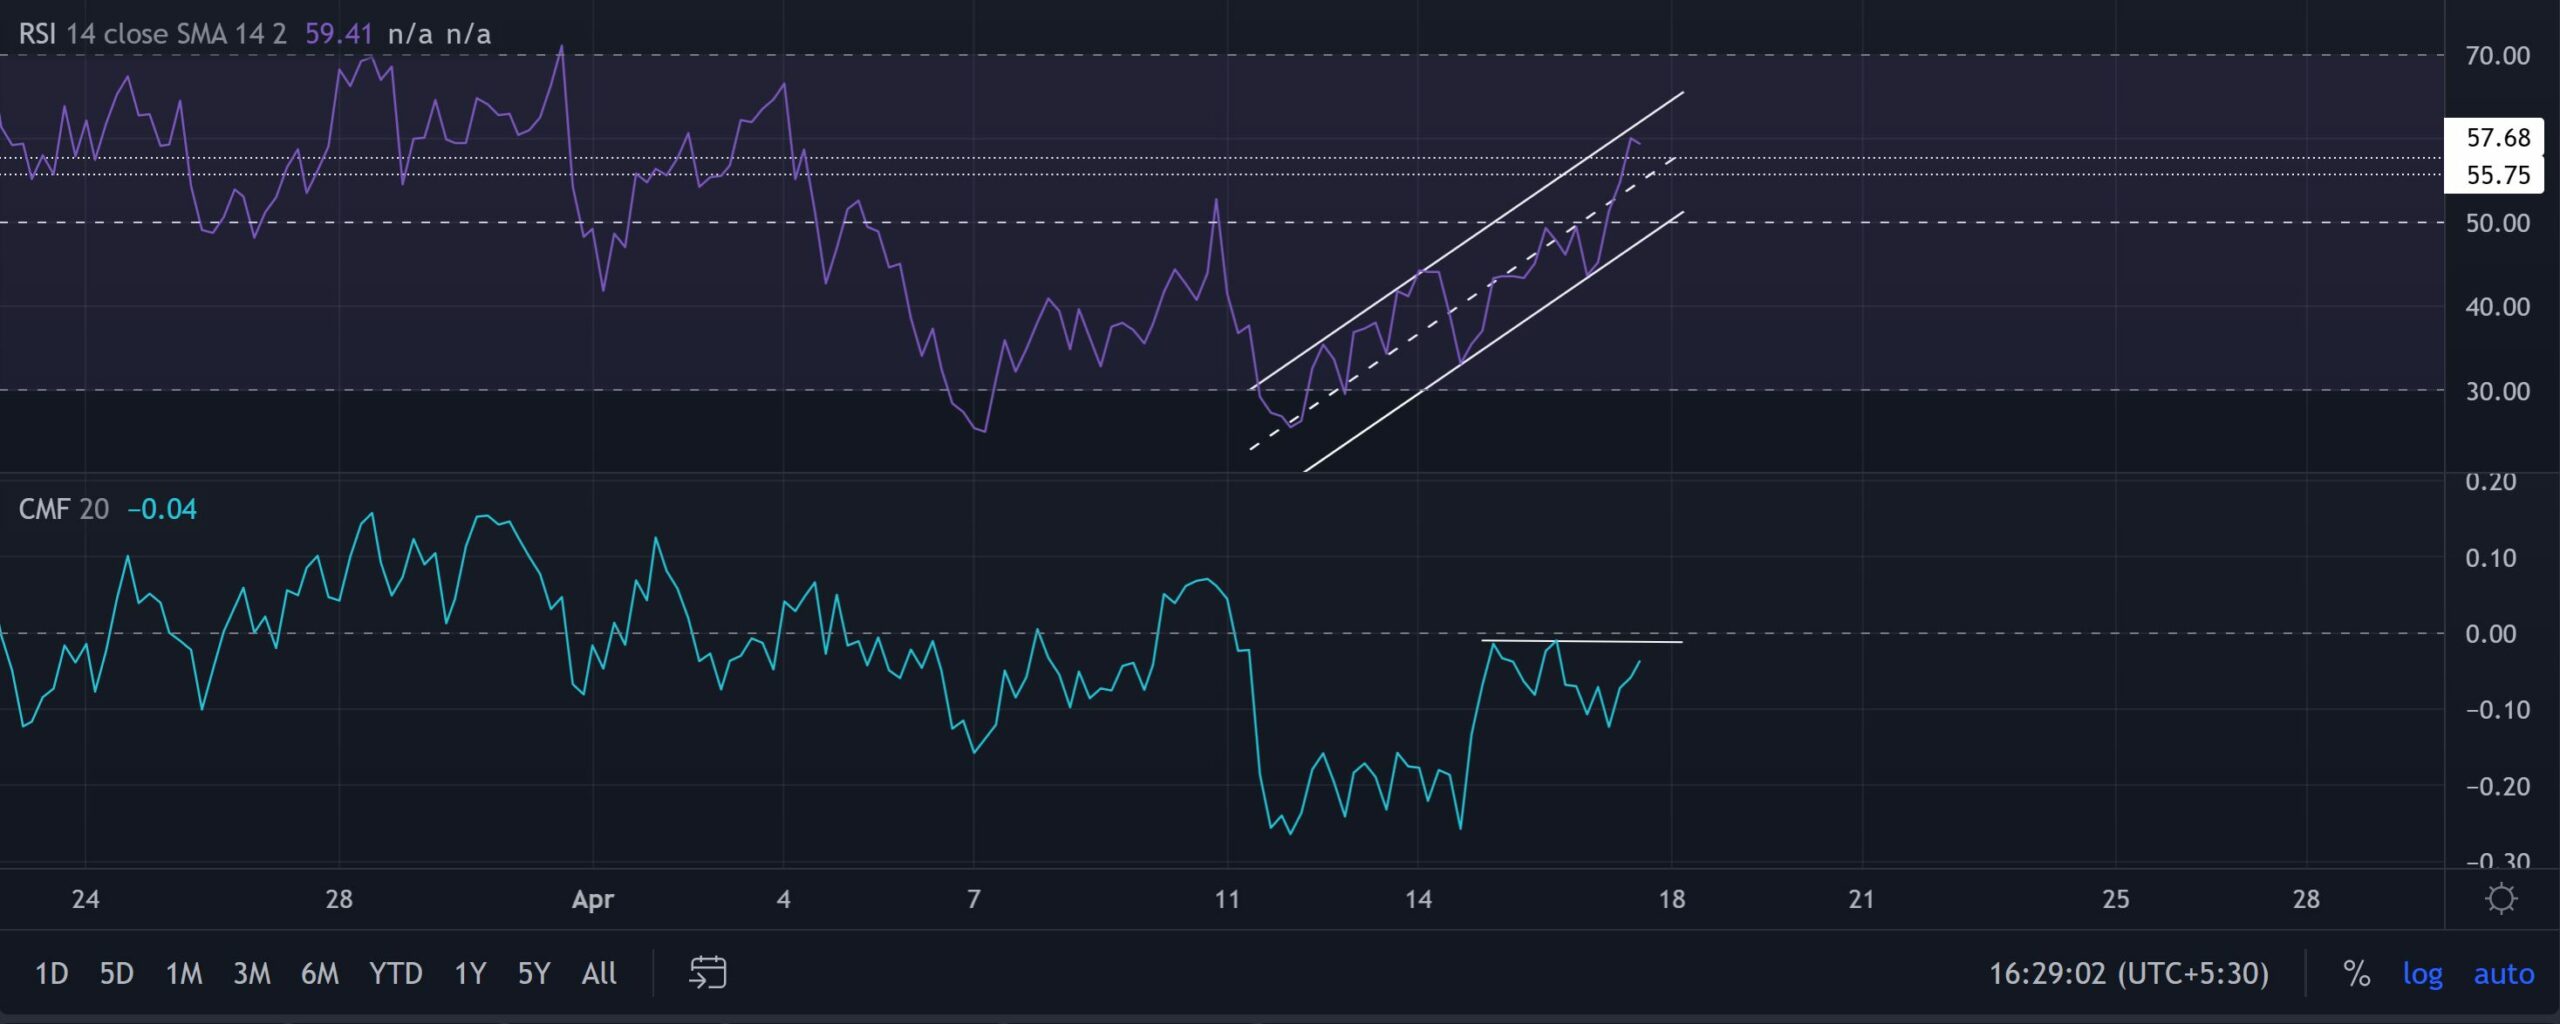
The RSI has been on a swift recovery path over the last five days. As the index found its ground above equilibrium, the buyers claimed a superior edge. From here on, the 55-57 support range would be crucial for the buyers to uphold to prevent a midline retest.
The CMF seemed to observe weak readings on the 4-hour timeframe. While the price managed to peak over the last two days, the oscillator marked a bearish divergence and struggled to cross the zero-mark.
Conclusion
The $14.5-level would be critical in determining an immediate growth trajectory for the alt. A close below this level could find a cushion around the $14.1-mark. Any close above the 23.6% level could lead to a delayed reversal on its charts.
Nevertheless, an overall market sentiment analysis will be vital. Especially to complement the technical factors and ascertain a profitable move.


![Bitcoin [BTC]](https://ambcrypto.com/wp-content/uploads/2025/06/Gladys-5-1-400x240.webp)