Assessing if RUNE will maintain its bullish momentum post this milestone

THORChain’s native cryptocurrency RUNE led the bullish charge after rallying by 20.90% in the last 24 hours at the time of writing. This makes it the top gainer in the top 50 list of cryptocurrencies by market cap, and the rally came after THORChain announced a major development milestone.
RUNE’s ongoing uptick likely points to the conclusion of its bearish pullback after peaking at $13.20 from its March rally. The price pulled back by roughly 45% from its end of March peak before bottoming out at $7.18 during Monday’s trading session.
RUNE traded at $8.98 at press time after encountering some resistance near the 61.80% Fibonacci retracement level. Another key observation is that RUNE’s 50-day moving average just crossed above the 200-day MA, forming a golden cross. The latter is considered a bullish sign but historical performance in such conditions also show that pullbacks and sideways price action are to be expected,
What is fueling RUNE’s price uptick?
RUNE’s bearish retracement from its March rally was strong enough to push below the 50% Fibonacci level. However, all the candles below that level seem to be localized within that price zone, suggesting that it may have played a part in the bounce-back.
Further investigation into THORChain’s project development activities reveals another factor that may have contributed to an influx of positive sentiment. THORChain announced on 18 April that its THORSwap aggregation API was finally complete and in its beta testing phase.
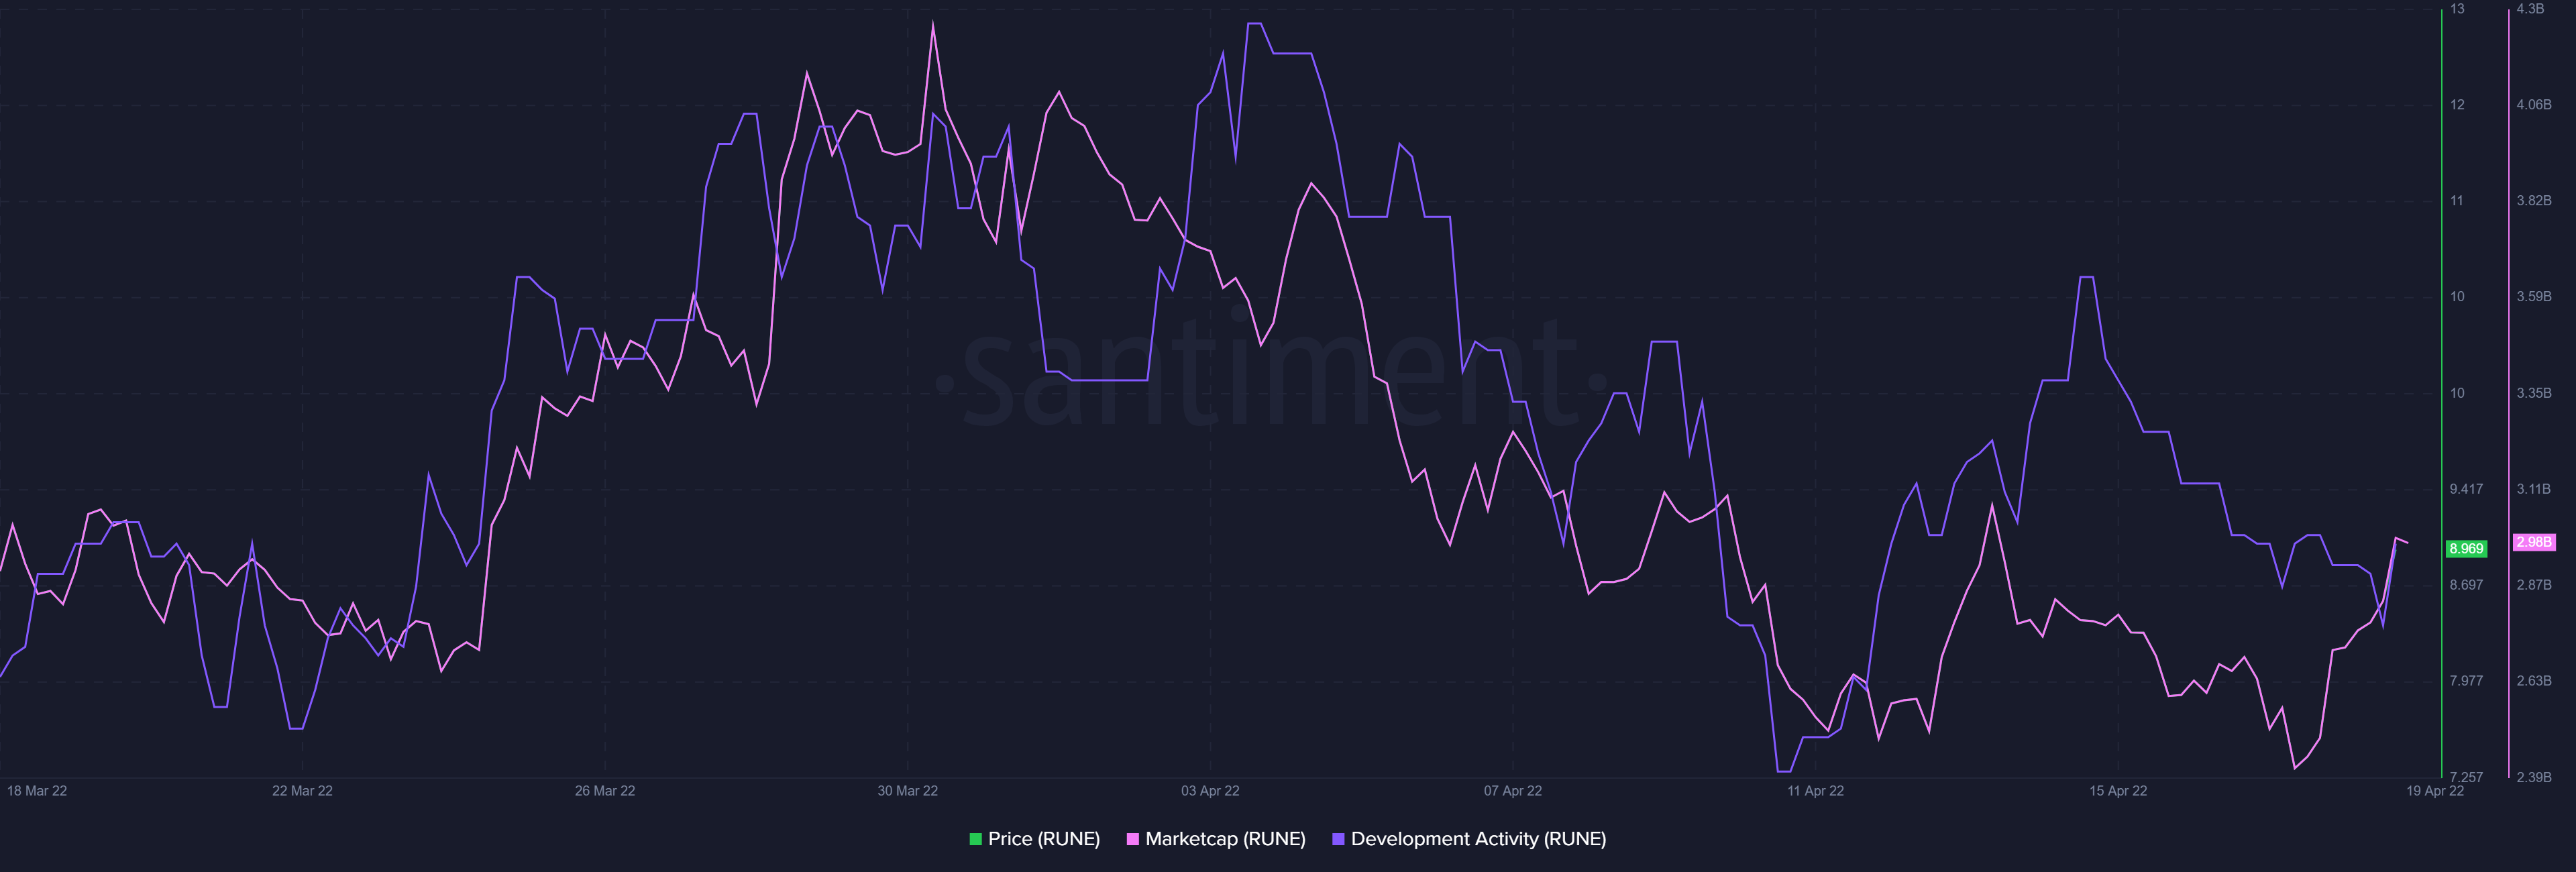
The announcement aligns with the developer activity metric which highlights strong activity in the last few weeks. However, that activity is tapering out now that the API is complete.
Will RUNE maintain its bullish momentum?
RUNE’s price and market cap performance in the last two days bounced back from their lowest point in the last four weeks. The highly volatile nature of the market makes it difficult to determine price direction.
Market forces may change at any time. RUNE’s macro picture reveals that it is still trading within a wedge pattern underscored by support and resistance.


