Assessing MANA’s potential to hold itself above key levels

Over the past ten days, Decentraland (MANA) hovered near its high liquidity range (Point of Control/POC) at the $2.6-mark before the bears steered the trend in their favor.
A close below the $2.36-support could propel a continued retracement in its falling wedge (white). An eventual break from the current pattern would set MANA up for a test of the immediate supply zone in the $2.4-zone. At press time, MANA traded at $2.3835, down by 2.58% in the last 24 hours.
MANA 4-hour Chart
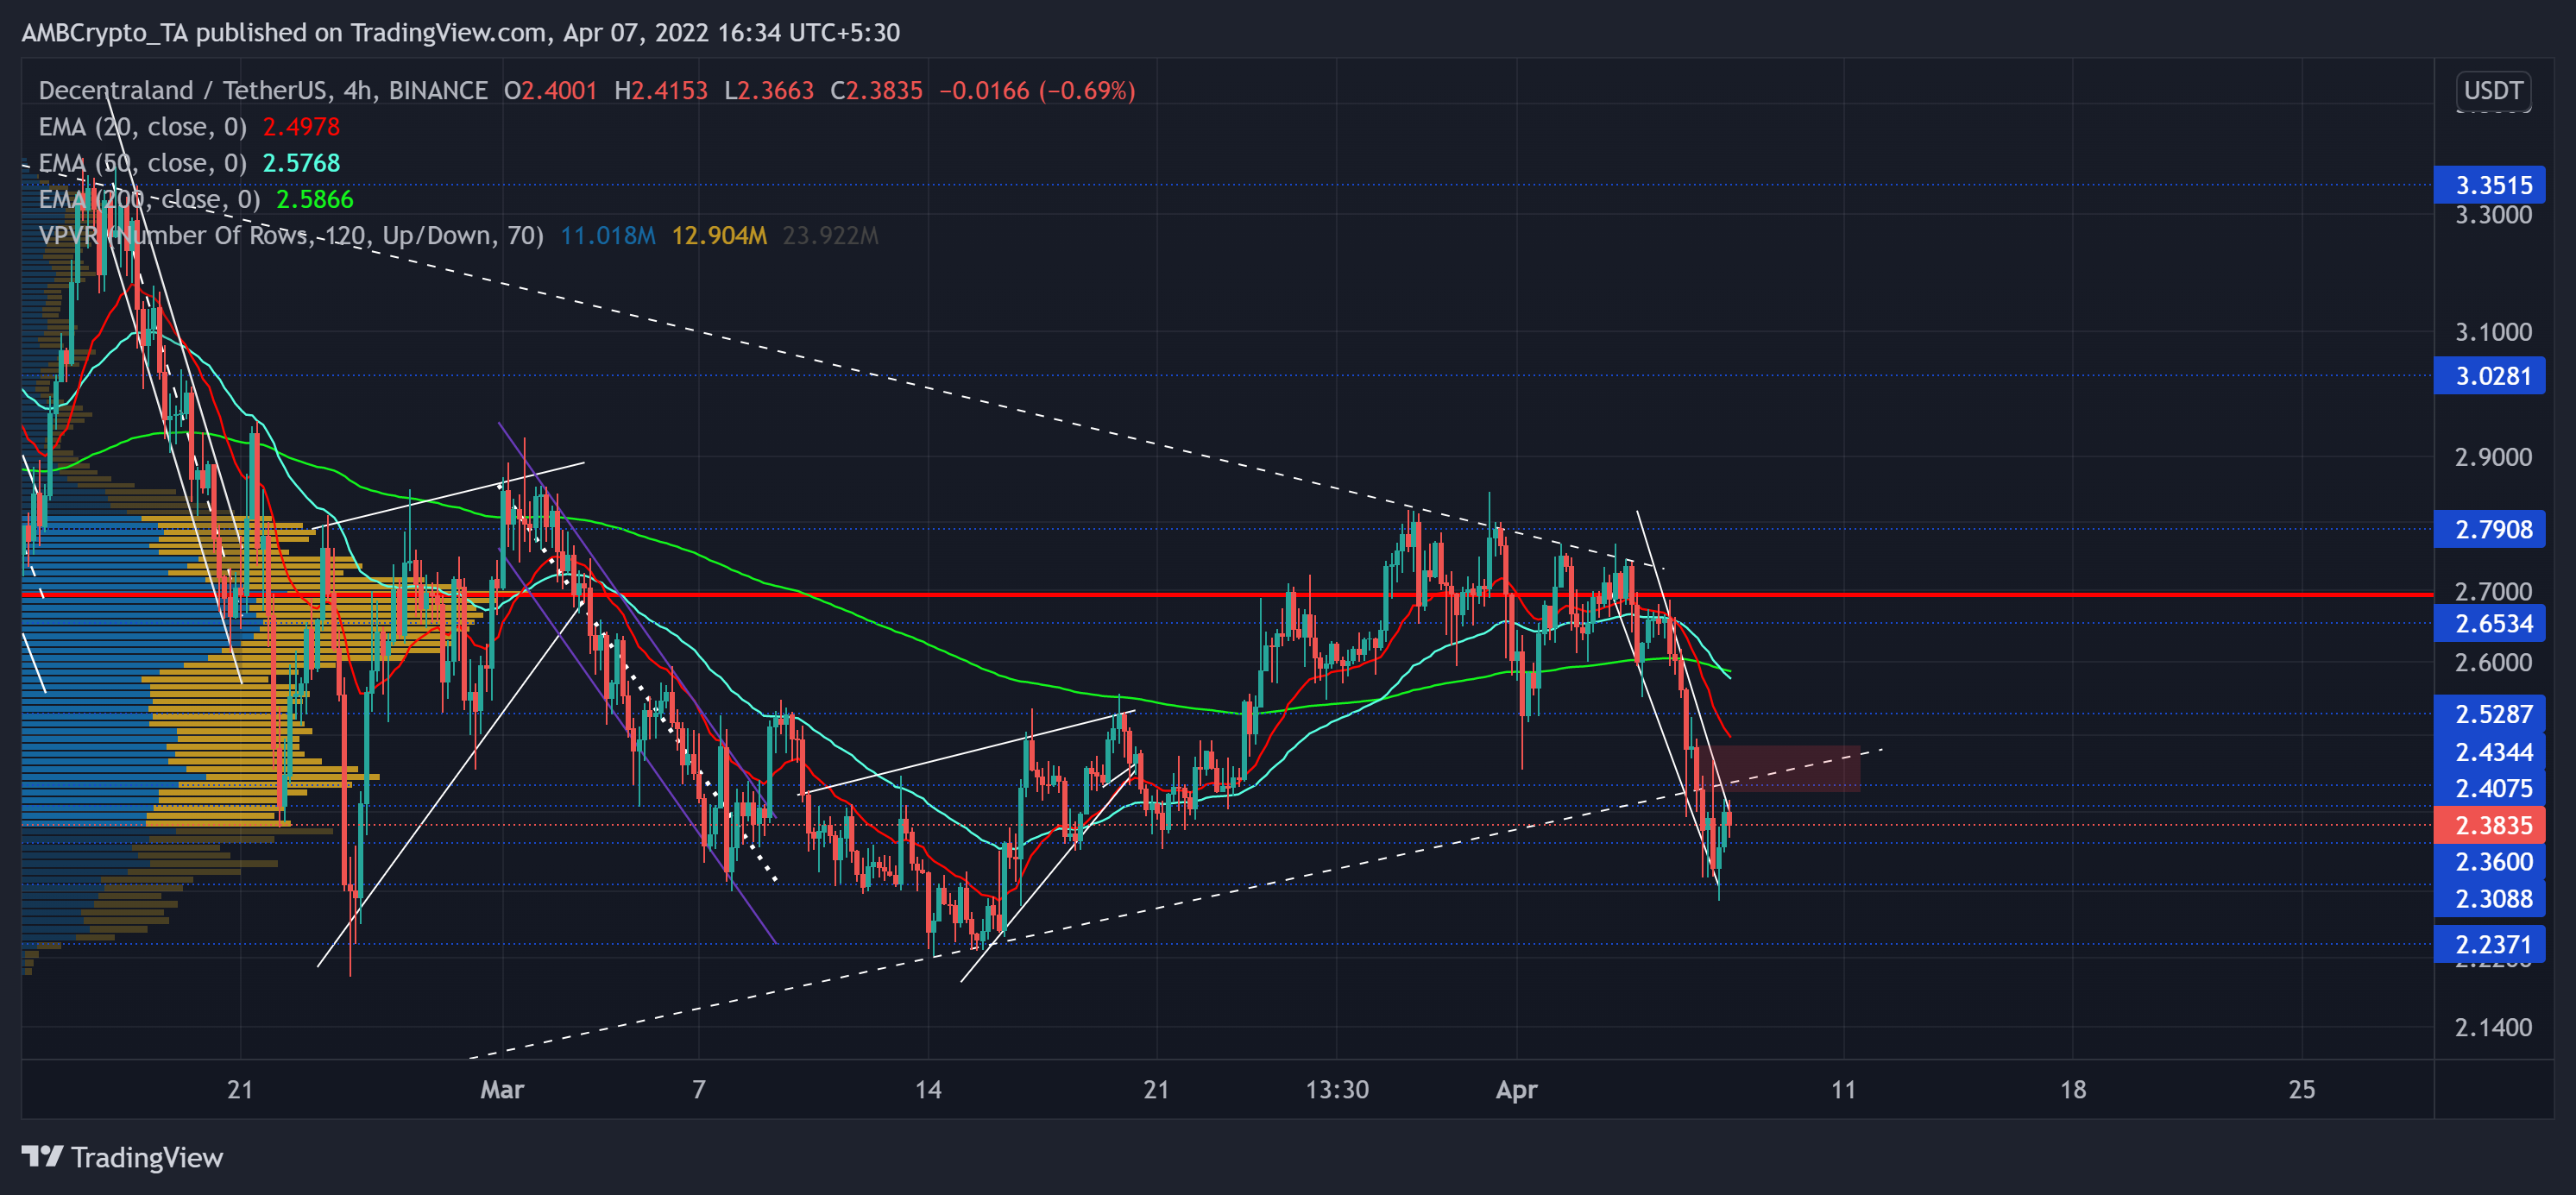
After down sliding from its ATH and poking its multi-month low in late January, the $3.3-level shunned all bullish recovery attempts. Despite this, the bulls have ensured higher troughs but failed to uphold the 11-week-long trendline support (now resistance) (white, dashed).
Over the last five days, MANA descended in a falling wedge (white) on its 4-chart. The price is now approaching a squeeze phase after a steep two-day plunge. Also, the recent bearish engulfing candlestick created a near-term supply zone for the alt in the $2.4-zone.
While the 50 EMA (cyan) undertakes a bearish crossover with the 200 EMA (green), MANA Could look at a long-term downside. But before that, any reversals from the $2.3-zone could result in a patterned breakout towards its 11-week trendline resistance.
Rationale
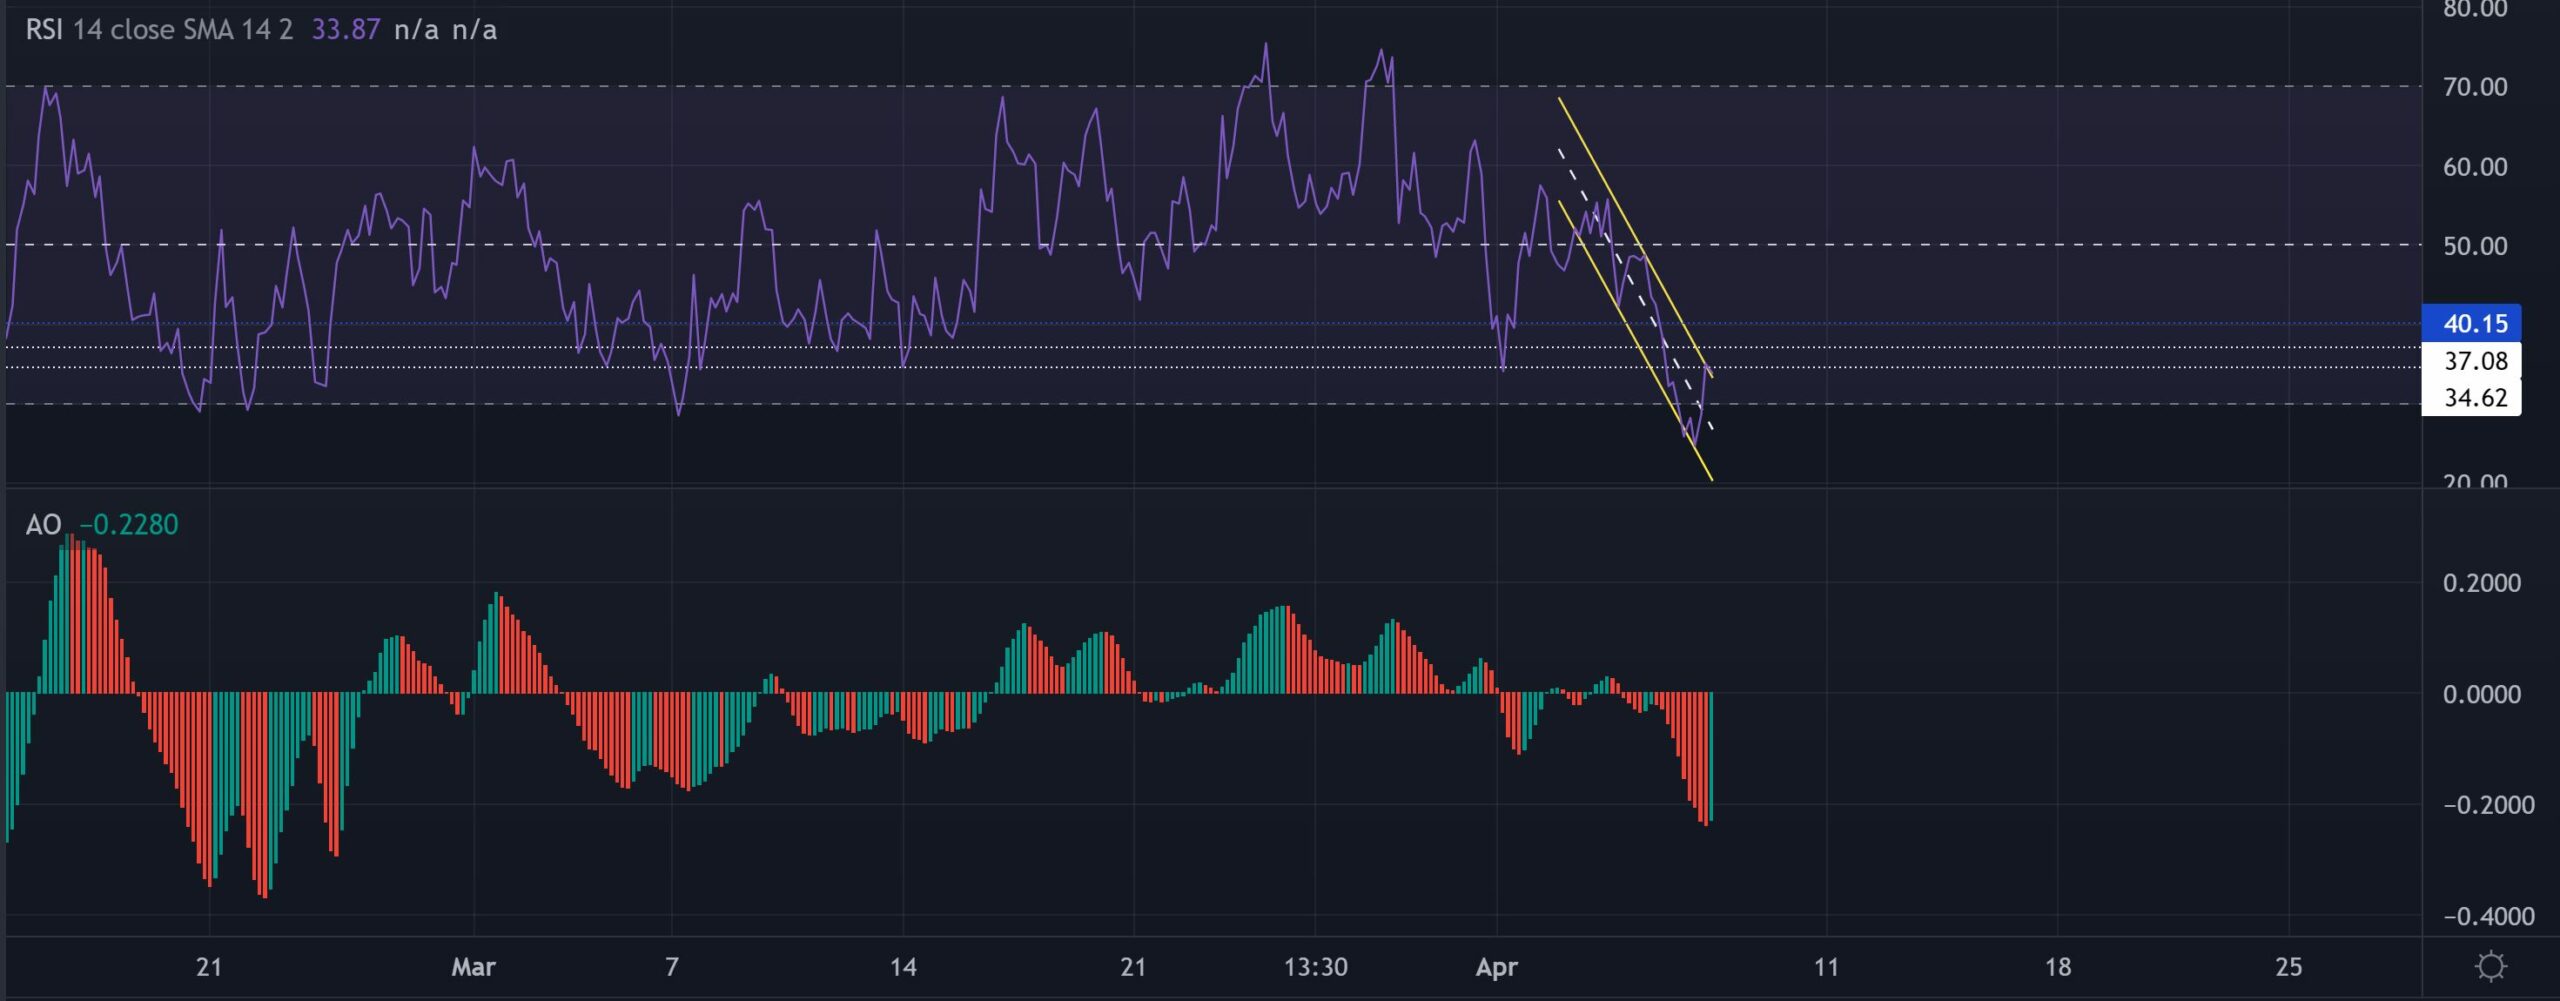
The RSI projected a strong bearish influence as it plummeted to the 24-mark on 7 April in its down-channel trajectory. A sustained close above the current pattern near the 34-37 range would lead to a test of the 40-mark resistance.
Further, the AO reaffirmed the RSI’s bearish inclination while keeping some recovery hopes alive in the days to come.
Conclusion
Since the EMA lines preferred the sellers, the immediate demand zone would continue to pose barriers in its recovery phase. A close above the current pattern could lead to a $2.4-mark retest before a probable pullback.
Moreover, the alt shares a whopping 90% 30-day correlation with Bitcoin. So, keeping a watch on the king coin’s movement would be useful to make a profitable bet.
![Stellar [XLM] crypto price prediction 2030: What would it take to reach $1?](https://ambcrypto.com/wp-content/uploads/2026/07/Adewale-2-1-4-e1785263791517.webp)