Cosmos: How likely a recovery is as ATOM slips below support amid intense selling

Disclaimer: The findings of the following analysis are the sole opinions of the writer and should not be considered investment advice
Data from Messari showed that in the past week the trading volume has been quite high and hovered around the $400m per day mark for Cosmos. This was in stark contrast to the earlier weeks of March when the daily trading volume was closer to $250m. This uptick in volume saw a strong Cosmos rally, followed by a sharp reversal.
ATOM- 1H
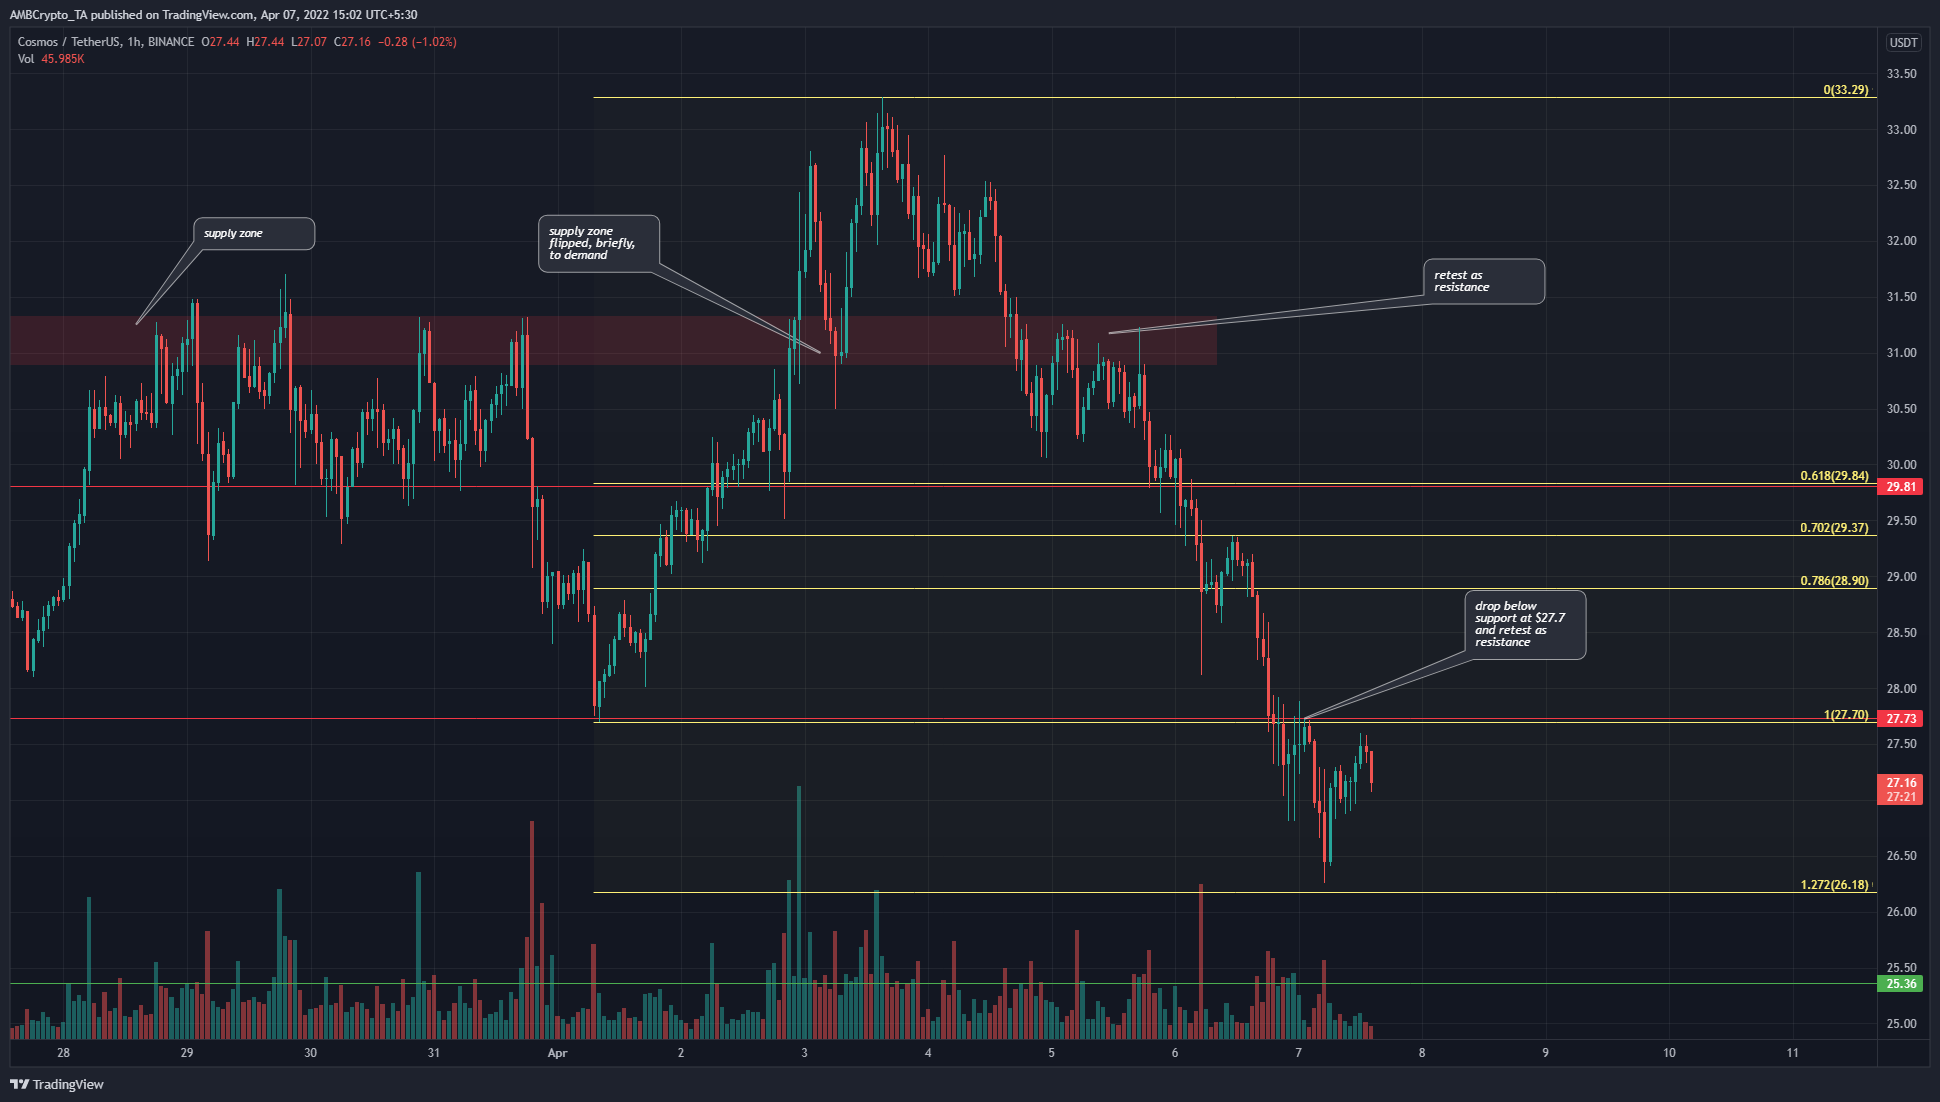
Fibonacci retracement levels (yellow) were plotted based on ATOM’s move from $27.7 to $33.29 early this month. In the past couple of days, the price has dropped below the $31 area (red box) and flipped to a supply zone once more. The $29.81-$28.9 area did not hold in the face of strong selling.
Therefore, in the lower timeframes, the momentum and market structure was bearish. The price has also slipped beneath $27.7 support level and retested it as resistance, and looked to be headed downward once more at the time of writing.
To the south, the $26.18-$25.36 area could act as a zone of demand.
Rationale
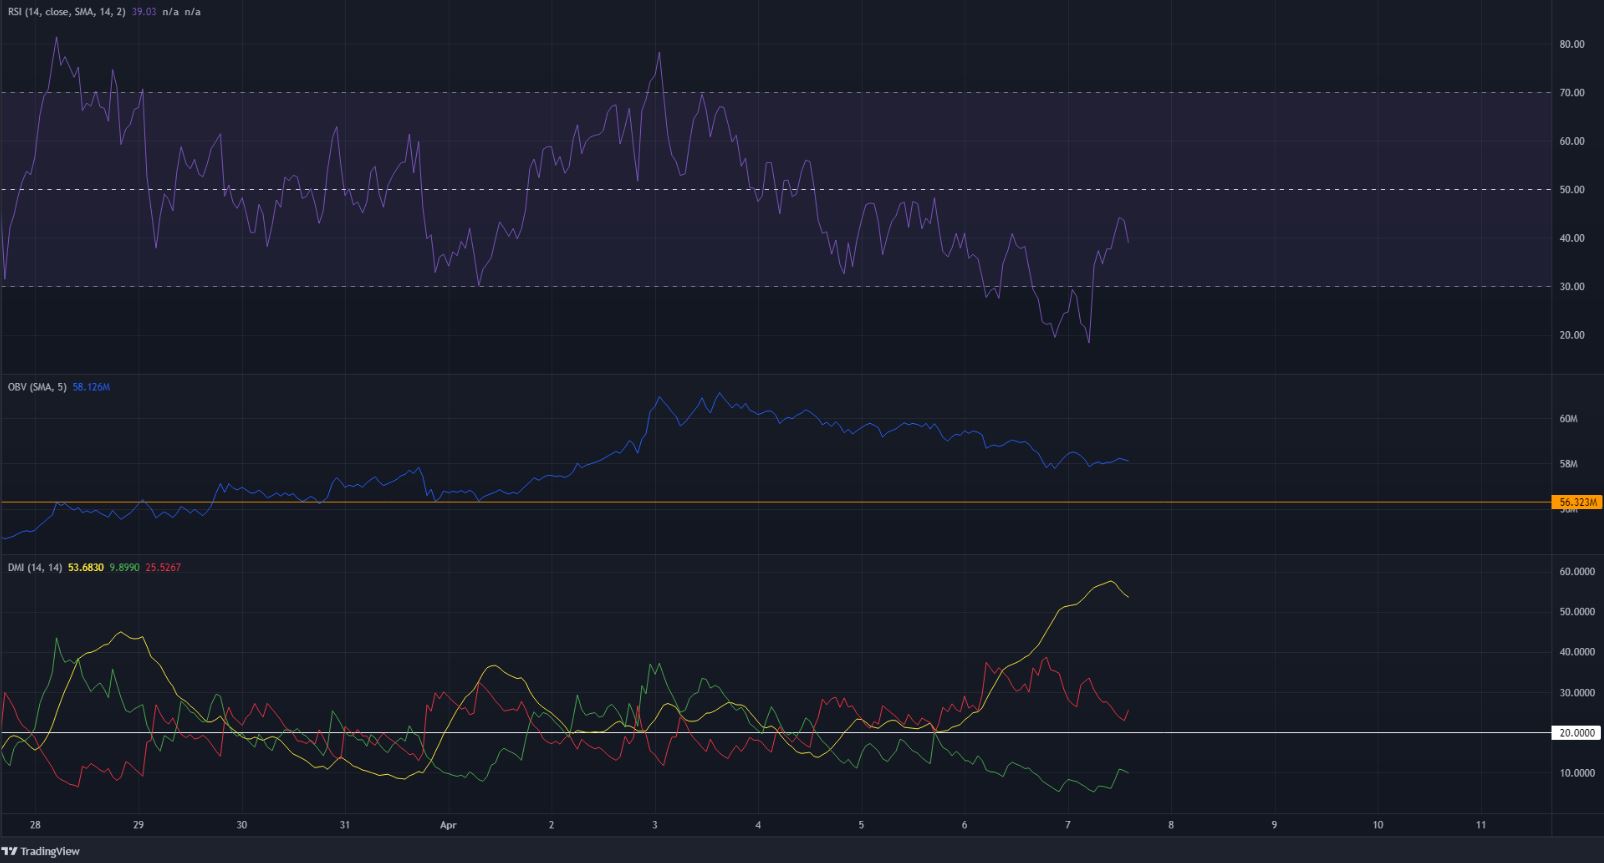
The RSI climbed toward neutral 50 as the price bounced, but the market structure was bearish and the momentum, on the hourly chart, appeared to be headed downward once more. Moreover, it was a discouraging sight for near-term bulls to see the $27.7 level flipped from support to resistance.
The DMI also showed that a strong bearish trend was in progress while the RSI was moving below the 40 mark- together, they spelt bearish pressure. On the other hand, the OBV did see a drop but not a drop large enough to reach the orange level highlighted.
This meant that, even though the price has formed a lower low in the past week, the OBV has not. Which indicated that this leg downward was a reaction to fear in the market, and ATOM could see a bounce in the near future.
Conclusion
The momentum indicators showed bearishness, but the OBV shone a ray of hope for short-term ATOM bulls. On higher timeframes, the $26.4-$24.3 area was an area where ATOM can see some accumulation at, before a move upward.


