Assessing the possibility of Bitcoin falling to its 23 May swing low

Disclaimer: The findings of the following analysis are the sole opinions of the writer and should not be taken as investment advice
Failed breakout attempts have been a regular theme in the Bitcoin market of late. Its rally from 26-29 June failed to overturn the $36,500 price ceiling and its subsequent rallies were unable to topple $35,500 and $35,000. Market observers were put on alert once again after the price moved below $33K which presented the threat of another sell-off moving forward.
At the time of writing, Bitcoin was being traded at $32,741, up by a marginal 1% over the last 24 hours.
Bitcoin 4-hour chart
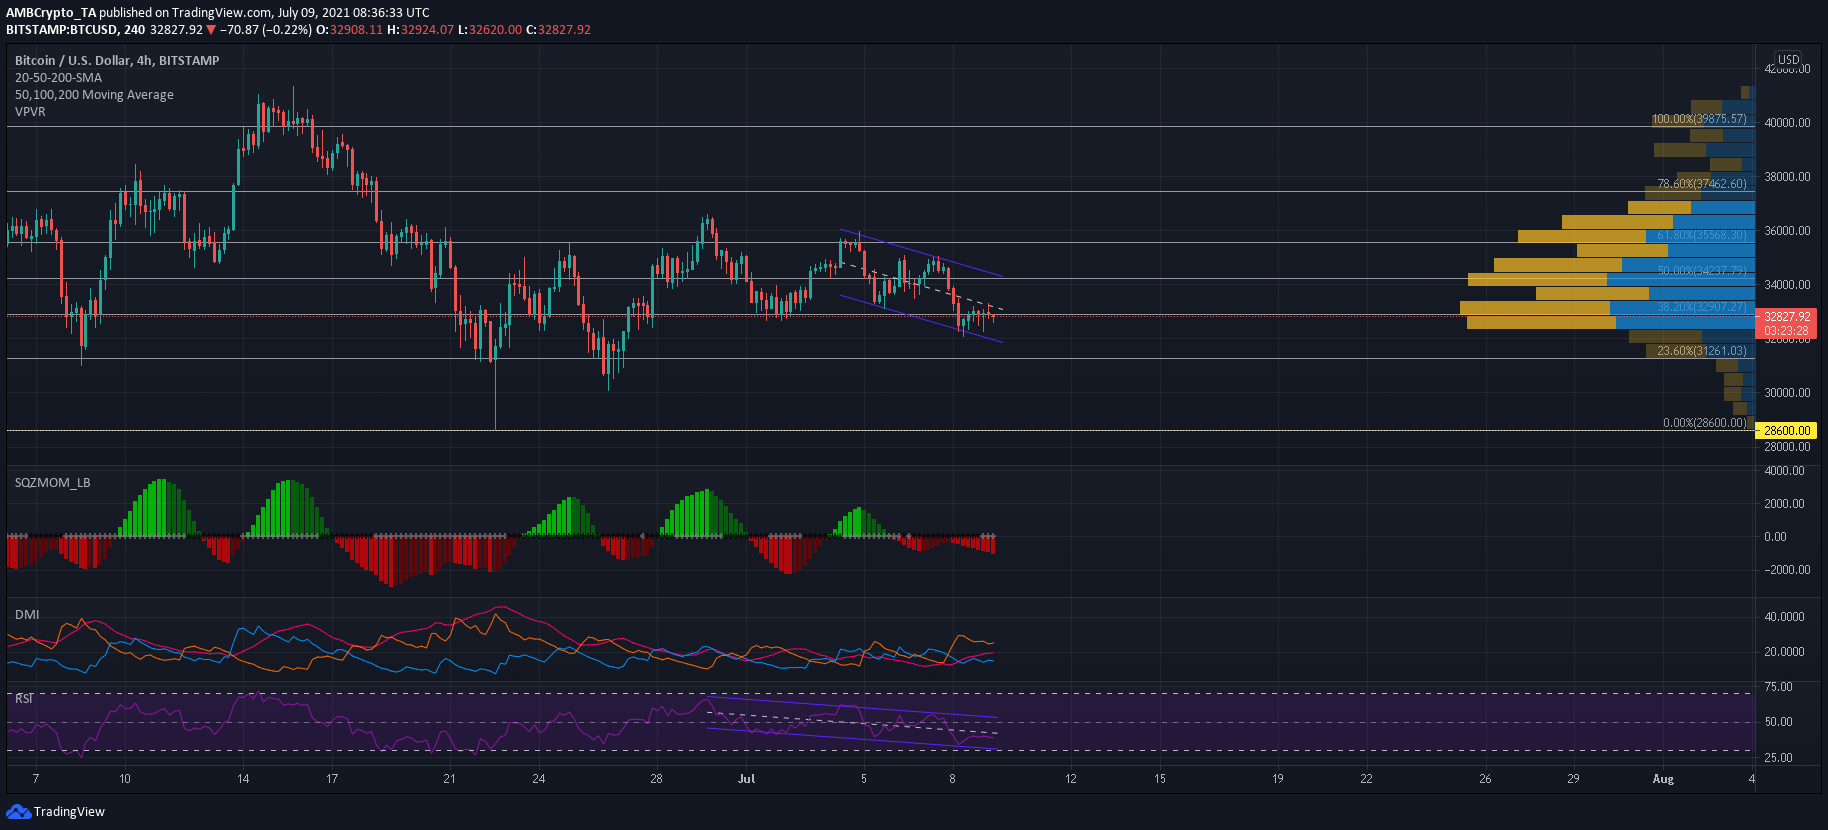
BTC’s chart highlighted the emergence of a down channel once the price failed to overturn the 61.8% Fibonacci extension ($35,568.3) and 200-SMA (green). Over the past few sessions, the price has hovered close to the 38.2% extension of $32,907 and the emergence of successive dragonfly candlesticks highlighted indecision in the market.
The Visible Range also showed a lot of interest for BTC at this price level. However, a close below the aforementioned Fib level could see BTC head towards the 23.6% extension and 23 May swing low close to $31,000.
Reasoning
The Squeeze Momentum Indicator noted rising bearish momentum, but what was more concerning was the pickup of volatility over the past few sessions. This indicated the possibility of sharper losses and movement towards the $31K level. The Relative Strength Index also moved within a down channel and would likely fall into the oversold zone before a trend reversal.
The Directional Movement Index was still indicative of a bearish trend as the -DI maintained itself above the +DI. The ADX clocked in at 18, but was pointing upwards at the time of writing. A move above 25 would denote a strengthening bearish trend.
Since sharper volatility and a stronger trend were yet to fully emerge in the BTC market, traders can be advised to adopt a wait and watch strategy before initiating a trade.
Conclusion
Bitcoin’s market was in contention between buyers and sellers at the 23.6% Fibonacci extension level ($32,907). Although buyers could cushion some of the selling pressure at the aforementioned level, the price was at risk of a sharper retracement, one that could drag Bitcoin towards its 23 May swing low of $31,107.

![Dogecoin [DOGE]](https://ambcrypto.com/wp-content/uploads/2026/07/Gladys-52-1-e1782893242505.jpg)