ATOM remains bearish, but bulls could force a breakout by…

Disclaimer: The information presented does not constitute financial, investment, trading, or other types of advice and is solely the writer’s opinion.
- The market structure was bearish on the four-hour timeframe.
- The demand seen in spot markets hinted at accumulation and a possible rally for Cosmos.
Cosmos [ATOM] has struggled on the price charts in the latter half of the month, after posting gains of 31% from 10 March to 14 March. Since then, the price has retraced most of those gains, but the buyers slowly clawed their way back into a position of strength.
Read Cosmos’ [ATOM] Price Prediction 2023-24
After the drop to the $10.65 level on 28 March, ATOM bulls were able to fight back the bearish malaise. Moreover, in the past week, they have succeeded in defending the $10.97-$11 support zone as well.
ATOM dips its toes into a bullish order block and recovery was in motion
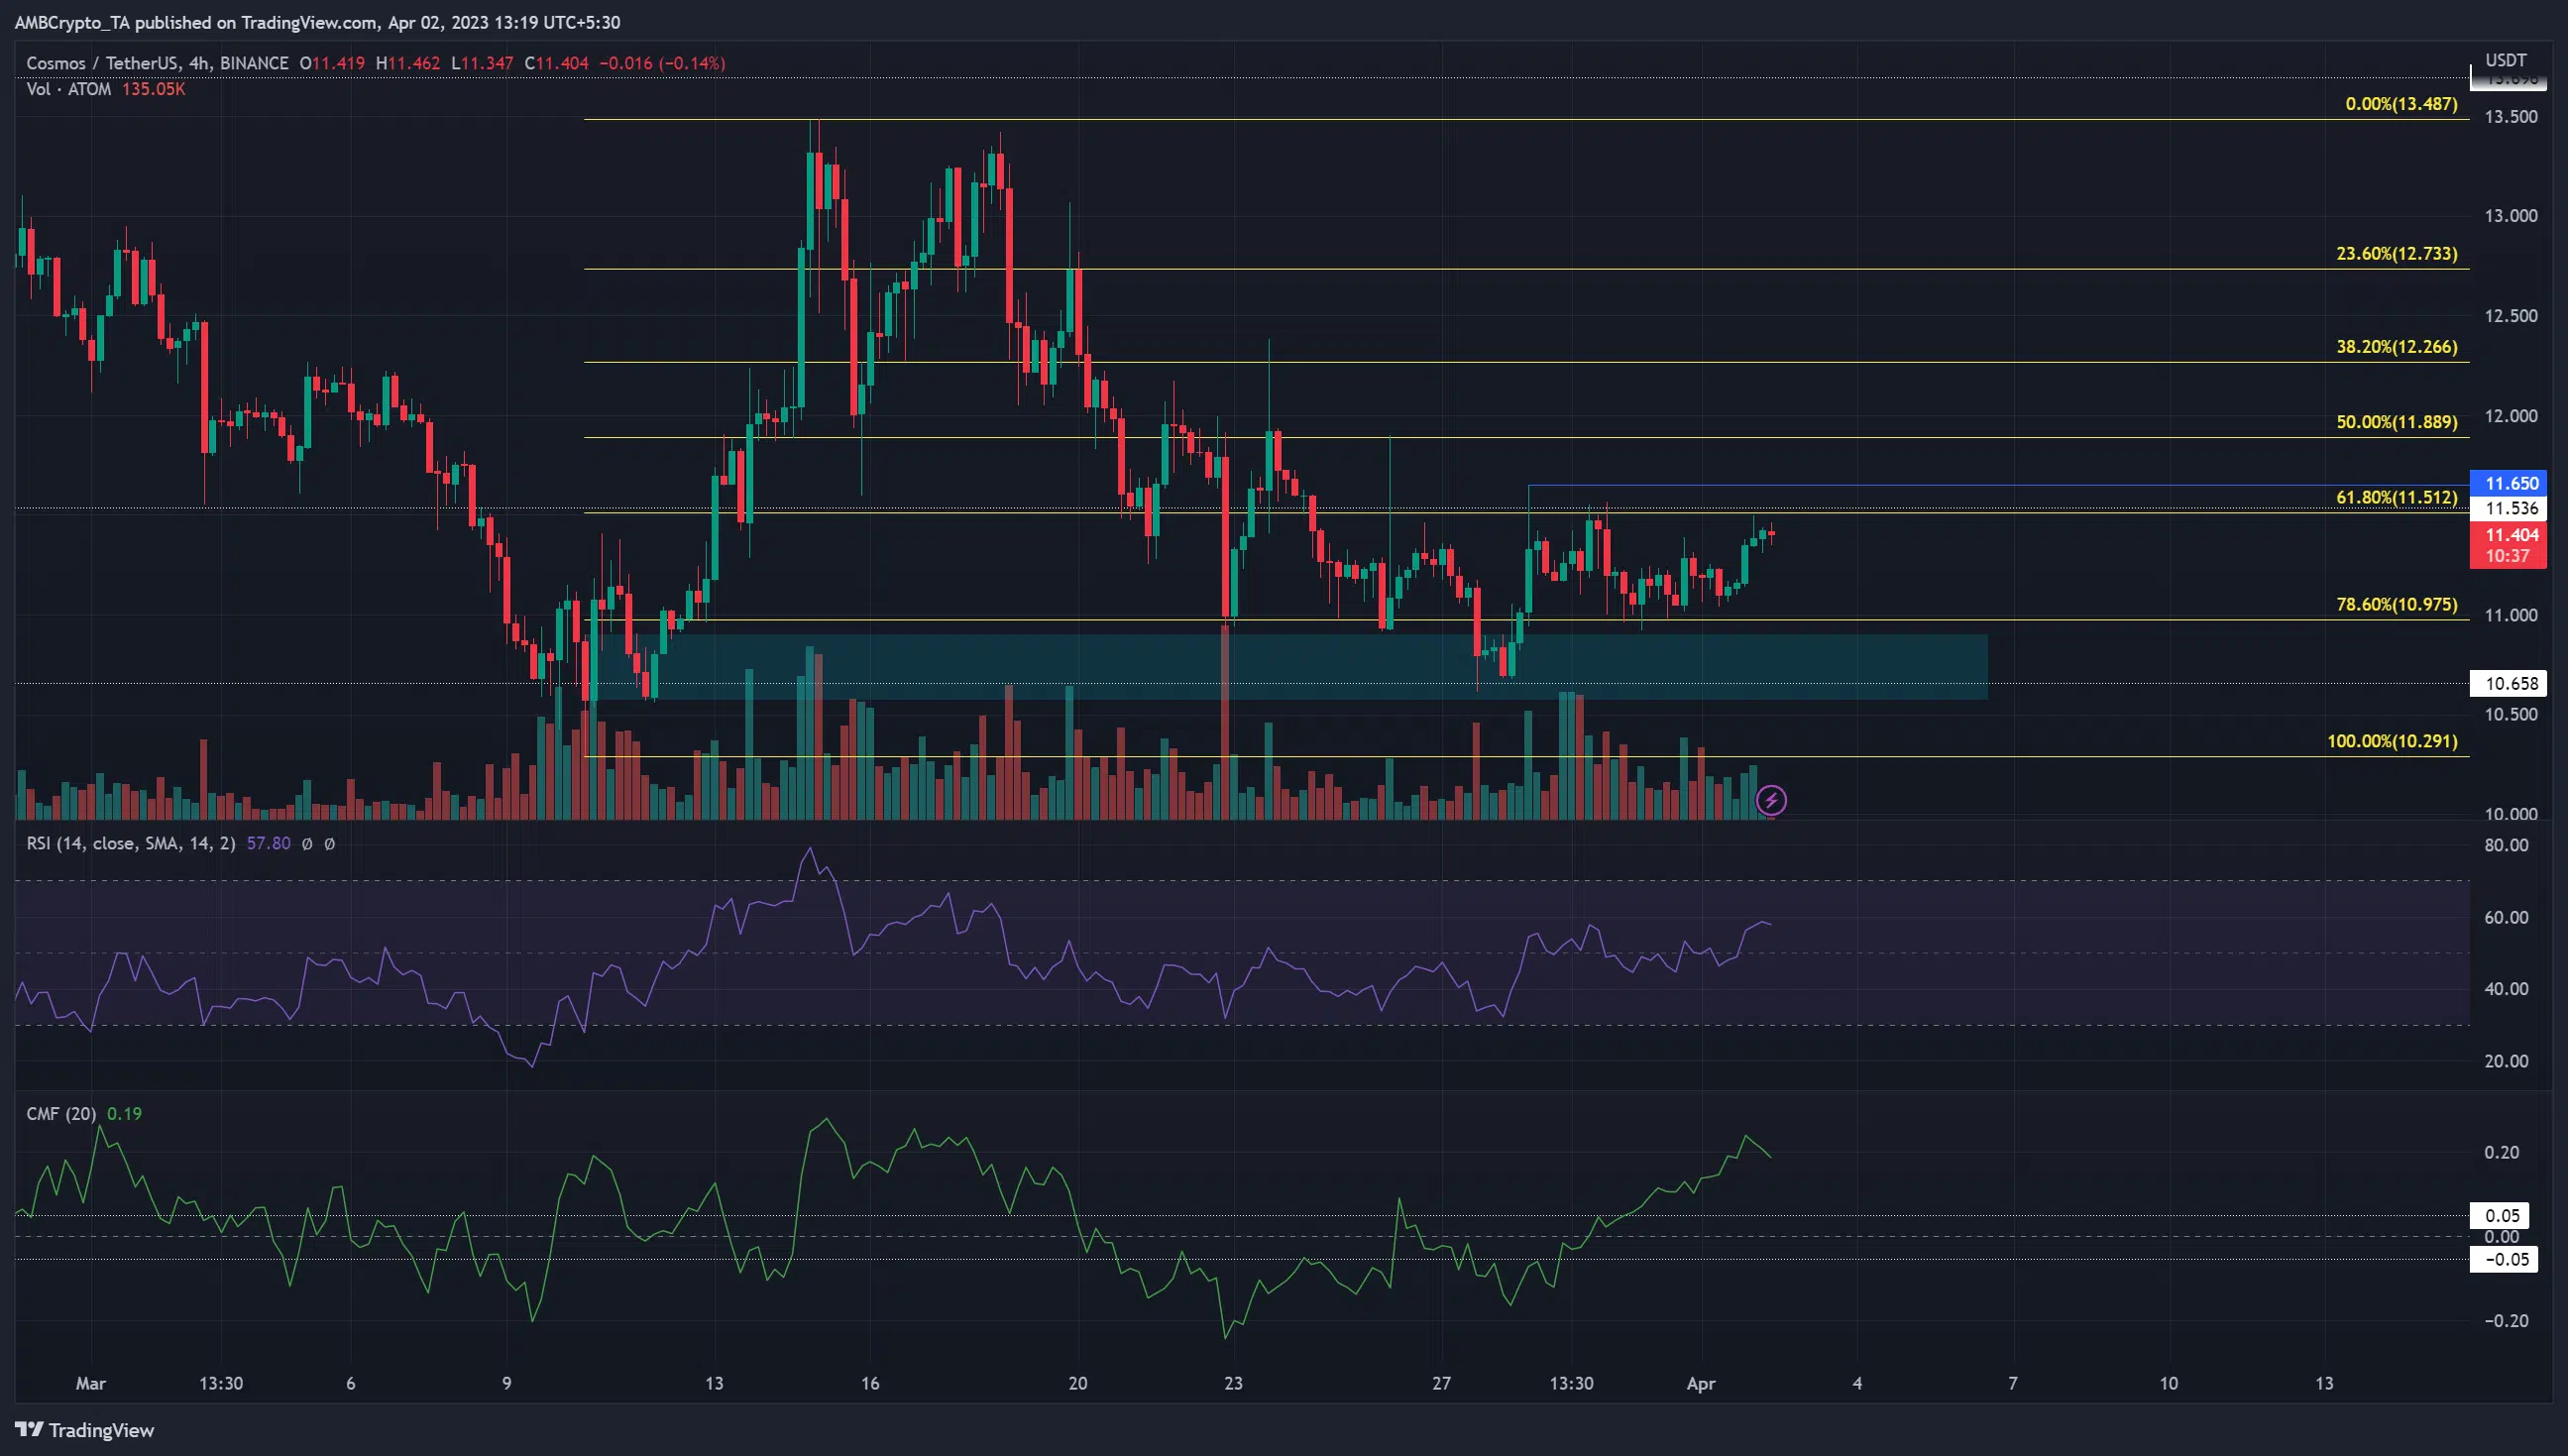
After the strong pump from $10.29 to $13.48 in mid-March, ATOM has been forced to retrace its gains on the price chart. It has made a series of lower highs and lower lows since breaking down beneath the $12.73 support level on 18 March.
The most recent lower high was marked by the blue line at $11.65. Using the candle wicks to establish structure makes the break in structure more significant if it occurs. In the past two weeks, despite the sudden spike in volatility that led to these large upper candlewicks, ATOM closed a session above a recent lower high.
Therefore, its structure remained bearish. Moreover, the Fibonacci retracement levels showed the $10.97 and $11.51 as the 78.6% and 61.8% retracement levels. The golden pocket is the area between these levels, but ATOM has already dropped beneath it. Below this region sat an H4 bullish order block at $10.6, highlighted in cyan.
The CMF has been climbing in recent days to show +0.19, while RSI also rose to 57.8 to show bullish momentum. Therefore, the lower high at $11.65 must be breached before the bias can turn bullish.
Is your portfolio green? Check out the Cosmos Profit Calculator
The spot CVD showed accumulation was in progress

Source: Coinalyze
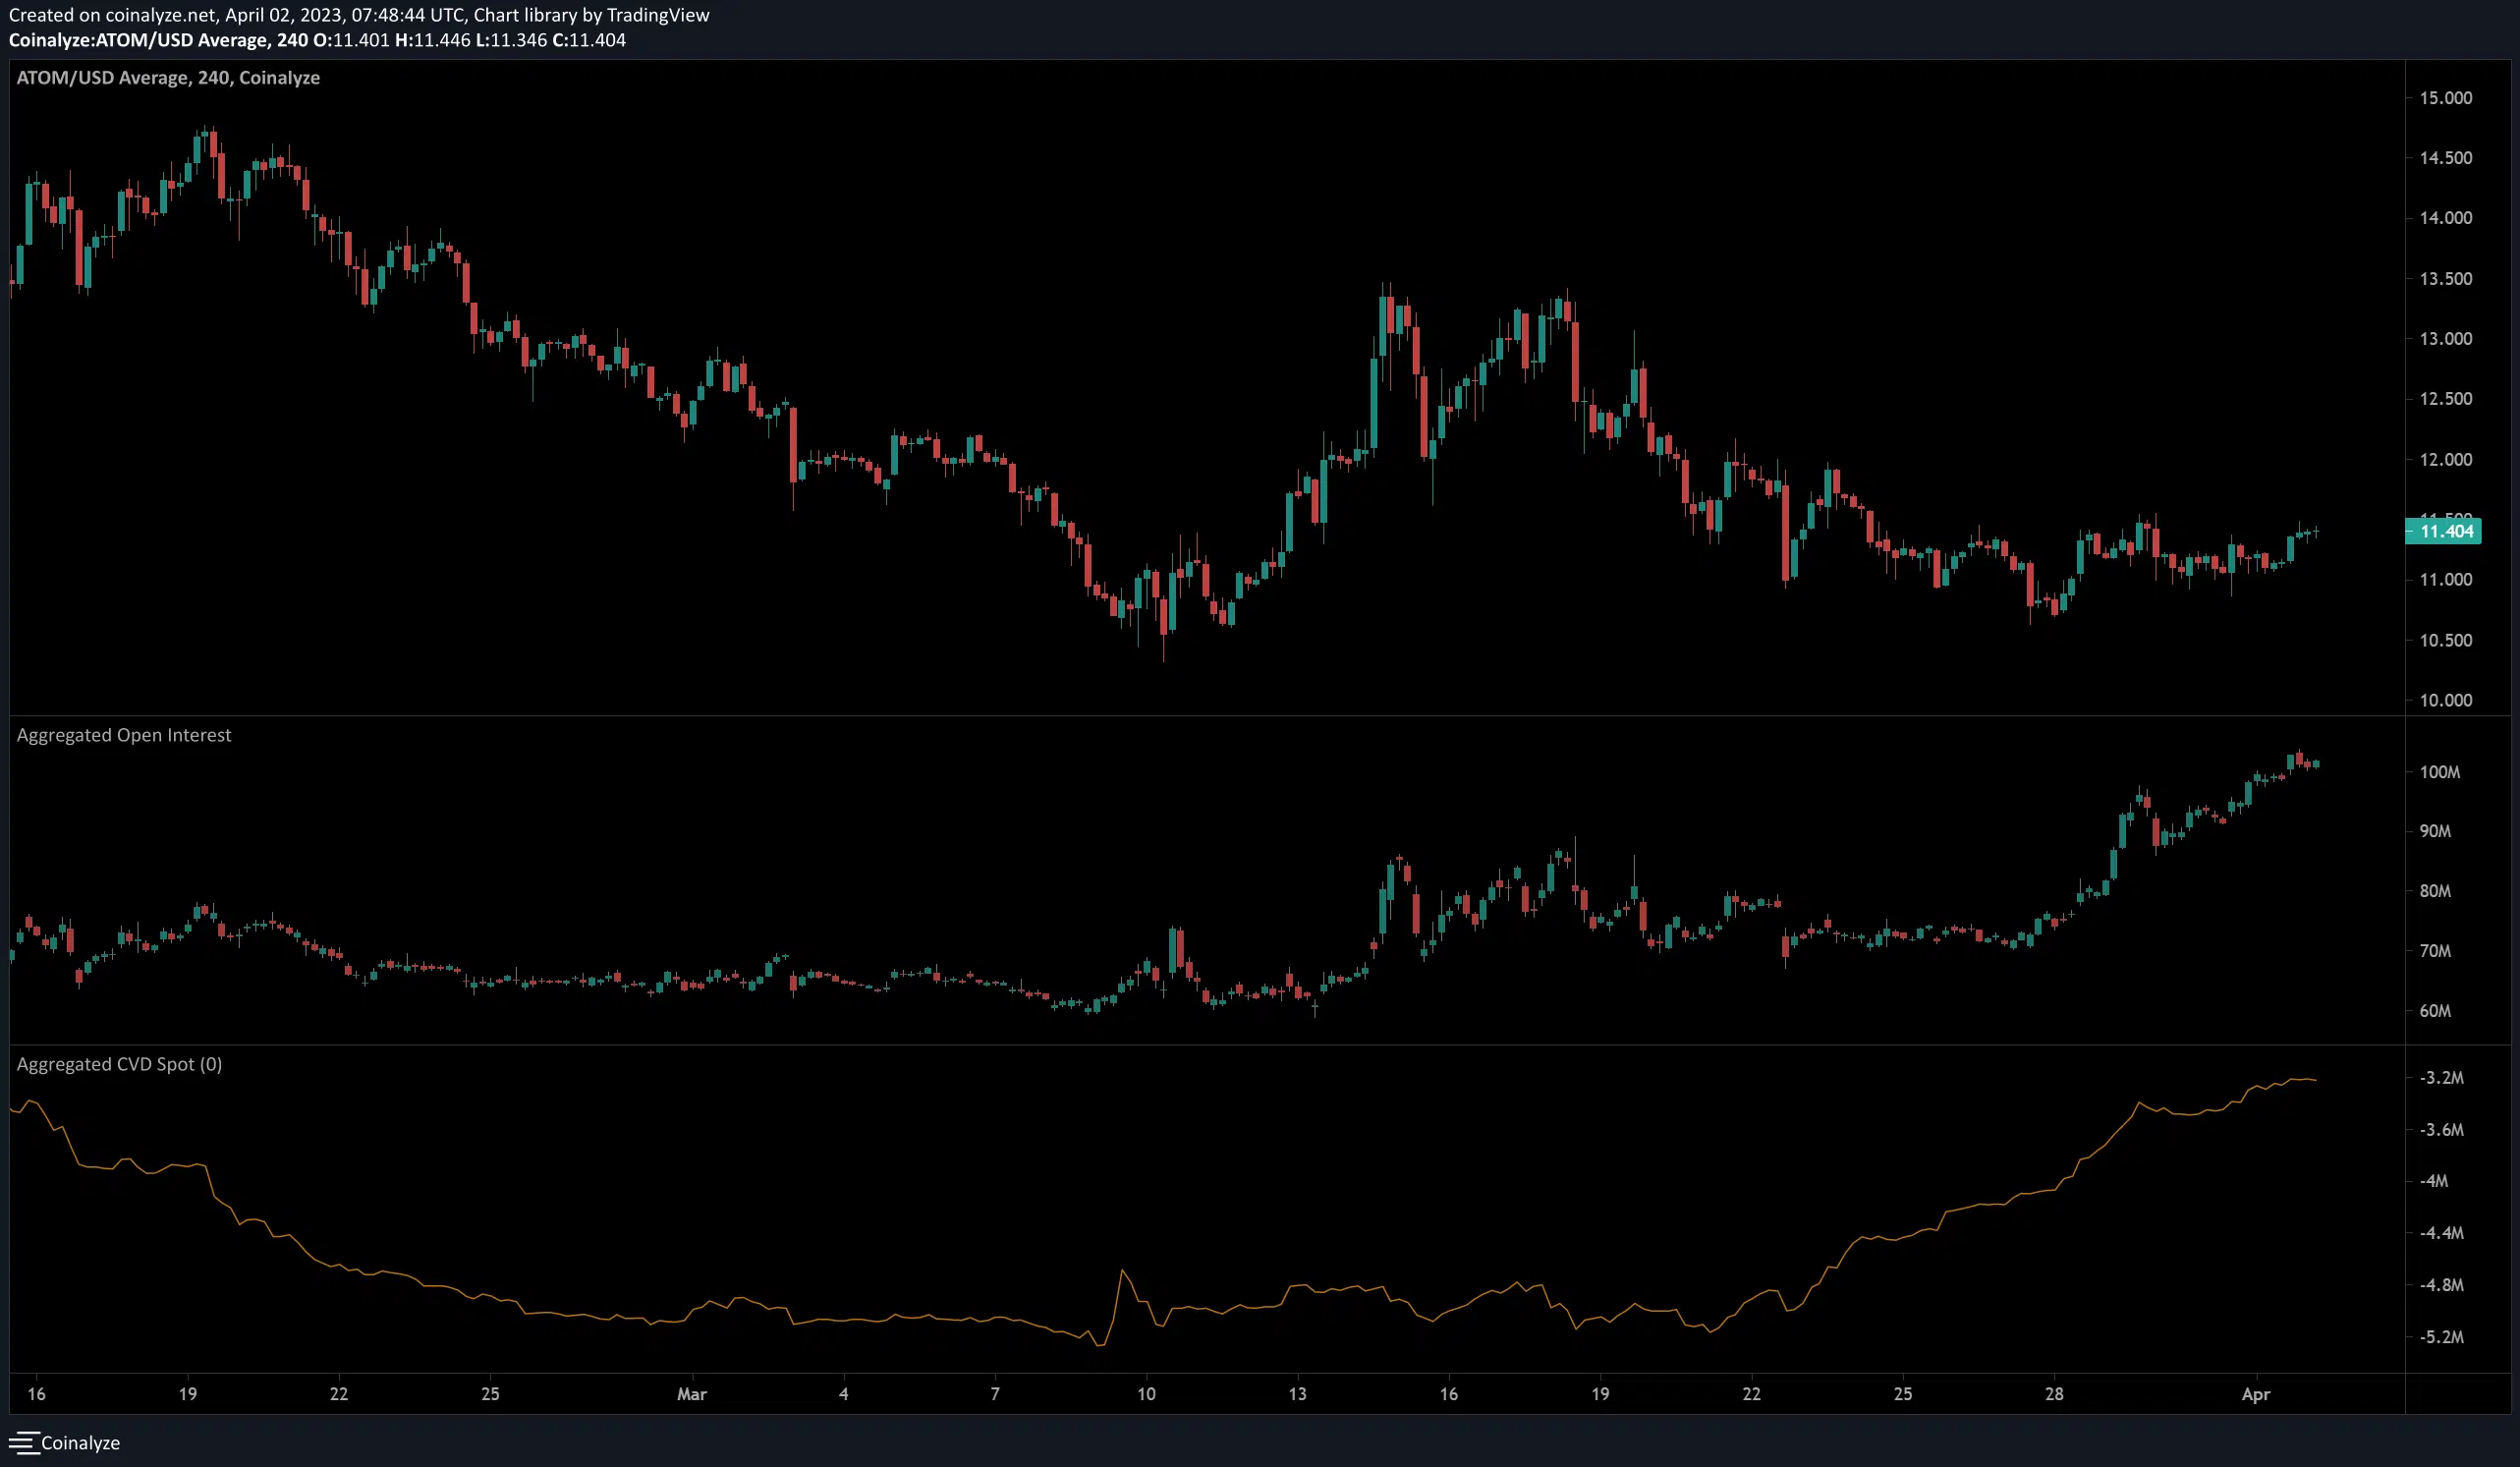
The Open Interest surged from $70 million on 27 March to $102.8 million on Saturday, even though ATOM itself was stuck beneath the $11.5 resistance. The spot CVD has also been in a strong uptrend since 22 March, which denoted heavy demand behind the token.
Therefore, it was likely that Cosmos bulls will drive the prices back above $11.5. The Fibonacci retracement levels can halt the bulls, at least temporarily.


