Avalanche [AVAX] rallies over the past week, but do not celebrate just yet

- After weeks, AVAX’s TVL registered an uptick
- However, bearish indicators suggested that a price reversal was on the cards
Avalanche’s [AVAX] performance of last week was worth praising as it registered double-digit gains. Investors had a great time, as according to CoinMarketCap, AVAX’s price increased by 15% during the period. At the time of writing, it was trading at $14.16 with a market capitalization of $4.3 billion.
Read Avalanche’s [AVAX] Price Prediction 2023-2024
However, the good days might soon end as a trend reversal is around the corner. As per CryptoQuant’s data, AVAX’s Relative Strength Index (RSI) was in an overbought position, which was bad news for AVAX holders.
The ‘but’ in the bad news
AVAX Daily, a popular Twitter account that posts updates related to the Avalanche ecosystem, recently uploaded the network’s weekly stats. The data revealed that Avalanche’s total transactions exceeded $13.5 million last week. Not only that, but the total amount staked crossed $250 million.
Avalanche Subnet Weekly Stats
Total Subnets: 39
Total Blockchains: 30
Total Validators: 1185
Total Stake Amount: 250,365,927 AVAXOverview??#AVAX #Avalanche $AVAX pic.twitter.com/Ld00gGxnit
— AVAX Daily ? (@AVAXDaily) December 4, 2022
Furthermore, Avalanche’s DeFi space, after witnessing decline for weeks, witnessed an uptick in AVAX’s total value locked.
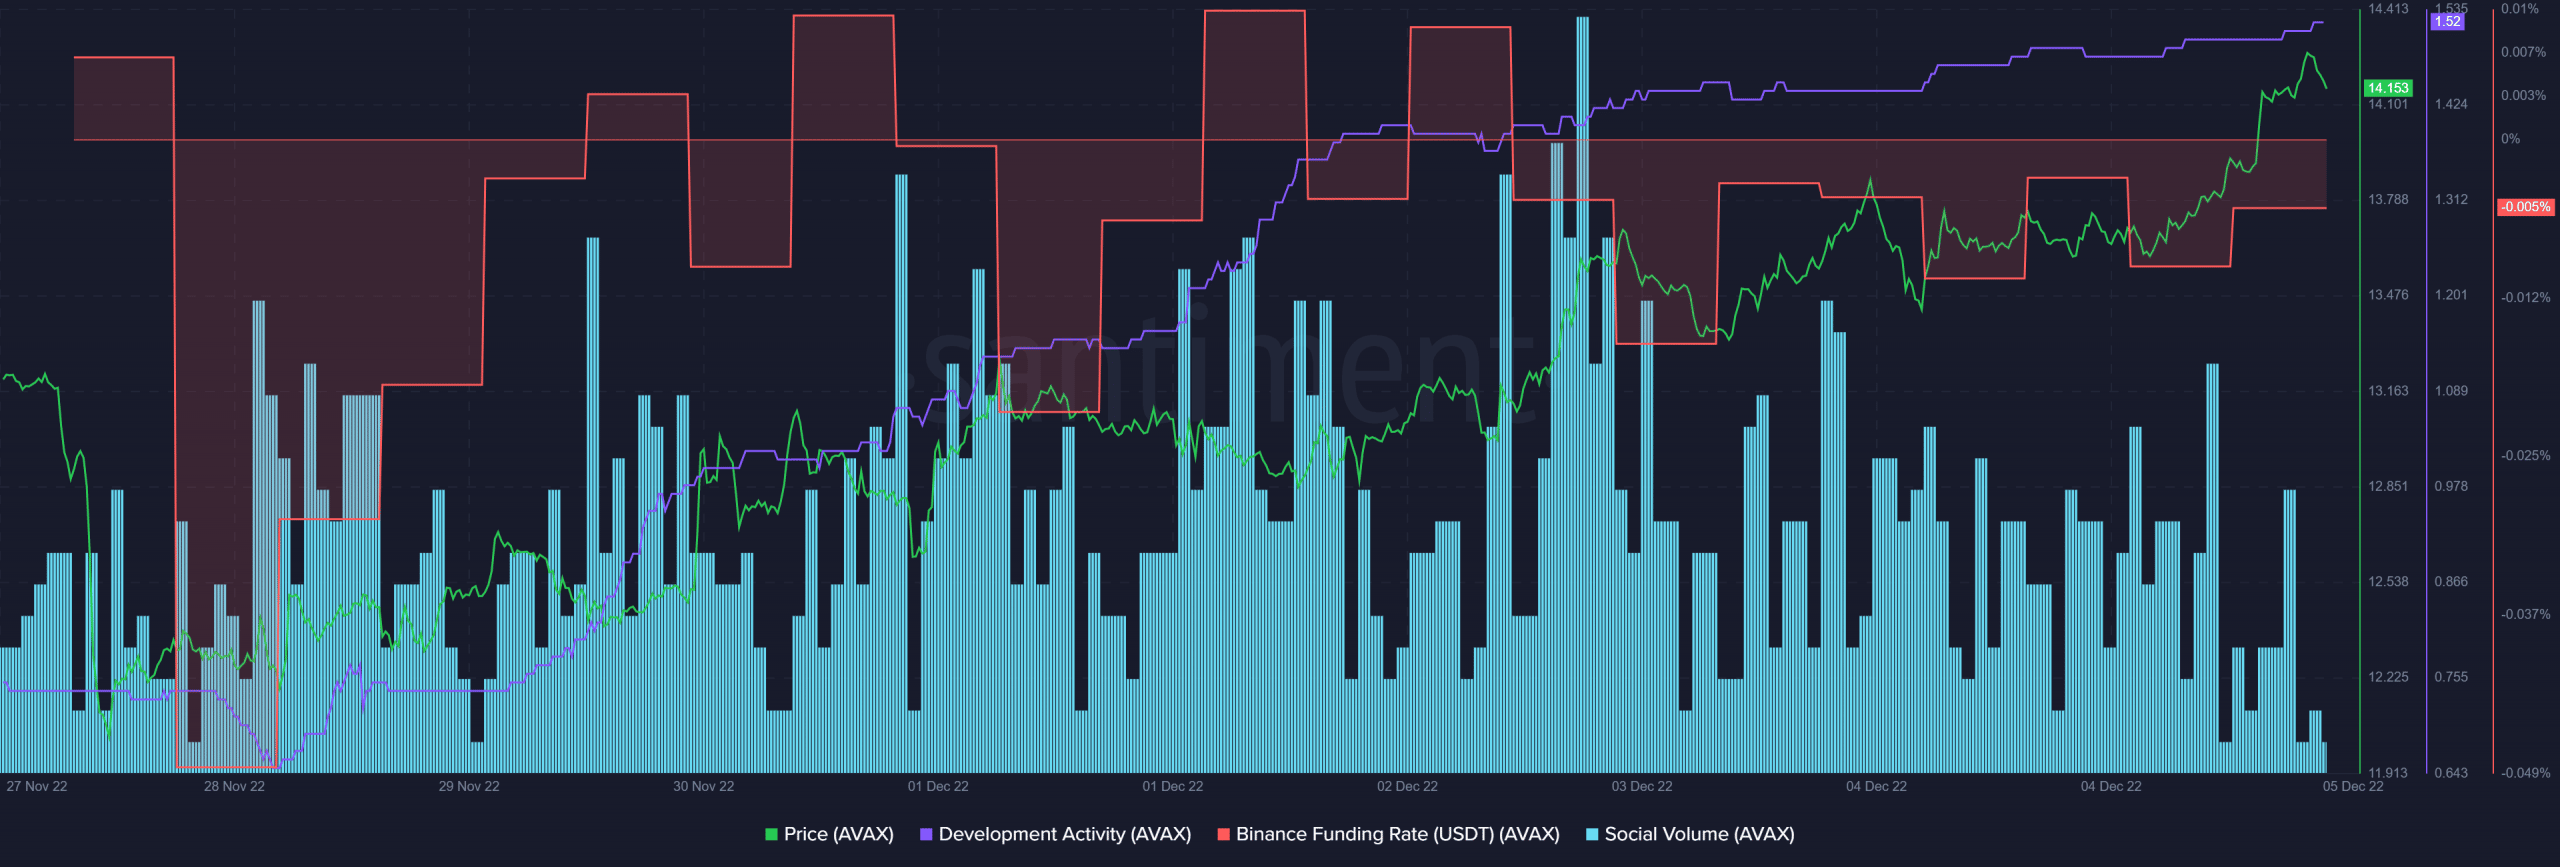
Though CryptoQuant’s data looked bearish, other on-chain metrics painted the opposite picture. For example, AVAX’s development activity increased significantly last week. This reflected the increased effort of developers to improve the blockchain.
AVAX’s Binance funding rate also went up as compared to last week. This suggested higher interest from the derivatives market. The network also remained quite popular in the crypto community as its social volume spiked.
A win-win here?
While the aforementioned metrics looked positive, AVAX’s daily chart revealed that sellers might gain an edge in the market in the days to come. For example, the Exponential Moving Average (EMA) ribbons revealed that the bears were leading as the 20-day EMA was resting below the 55-day EMA.
Moreover, AVAX’s Money Flow Index (MFI) entered the overbought zone, further increasing the chances of a price plummet. However, the Moving Average Convergence Divergence (MACD) provided much needed relief as it displayed a bullish crossover.


