Avalanche: On shorter timeframes, a move past this level could flip bias to bullish

Disclaimer: The findings of the following analysis are the sole opinions of the writer and should not be considered investment advice.
“Even after your favorite coin drops 90%, there is nothing that stops it from falling by yet another 90%”- anonymous crypto analyst on Twitter. It is true that not a lot of faith should be put into things said on Twitter, especially by anonymous accounts. Yet, this adage has been true in the 2018 bear market, and will likely be true in this cycle as well. Avalanche has fallen by nearly 76% since the start of May.
The funny thing is that there is nothing stopping the coin from shedding another 40% in value. Technical support levels below $14.6 lie at $9.7 and $5.1. With Bitcoin barely holding on to the $20k mark, another avalanche down the charts could be a likely scenario.
AVAX- 1 Day Chart
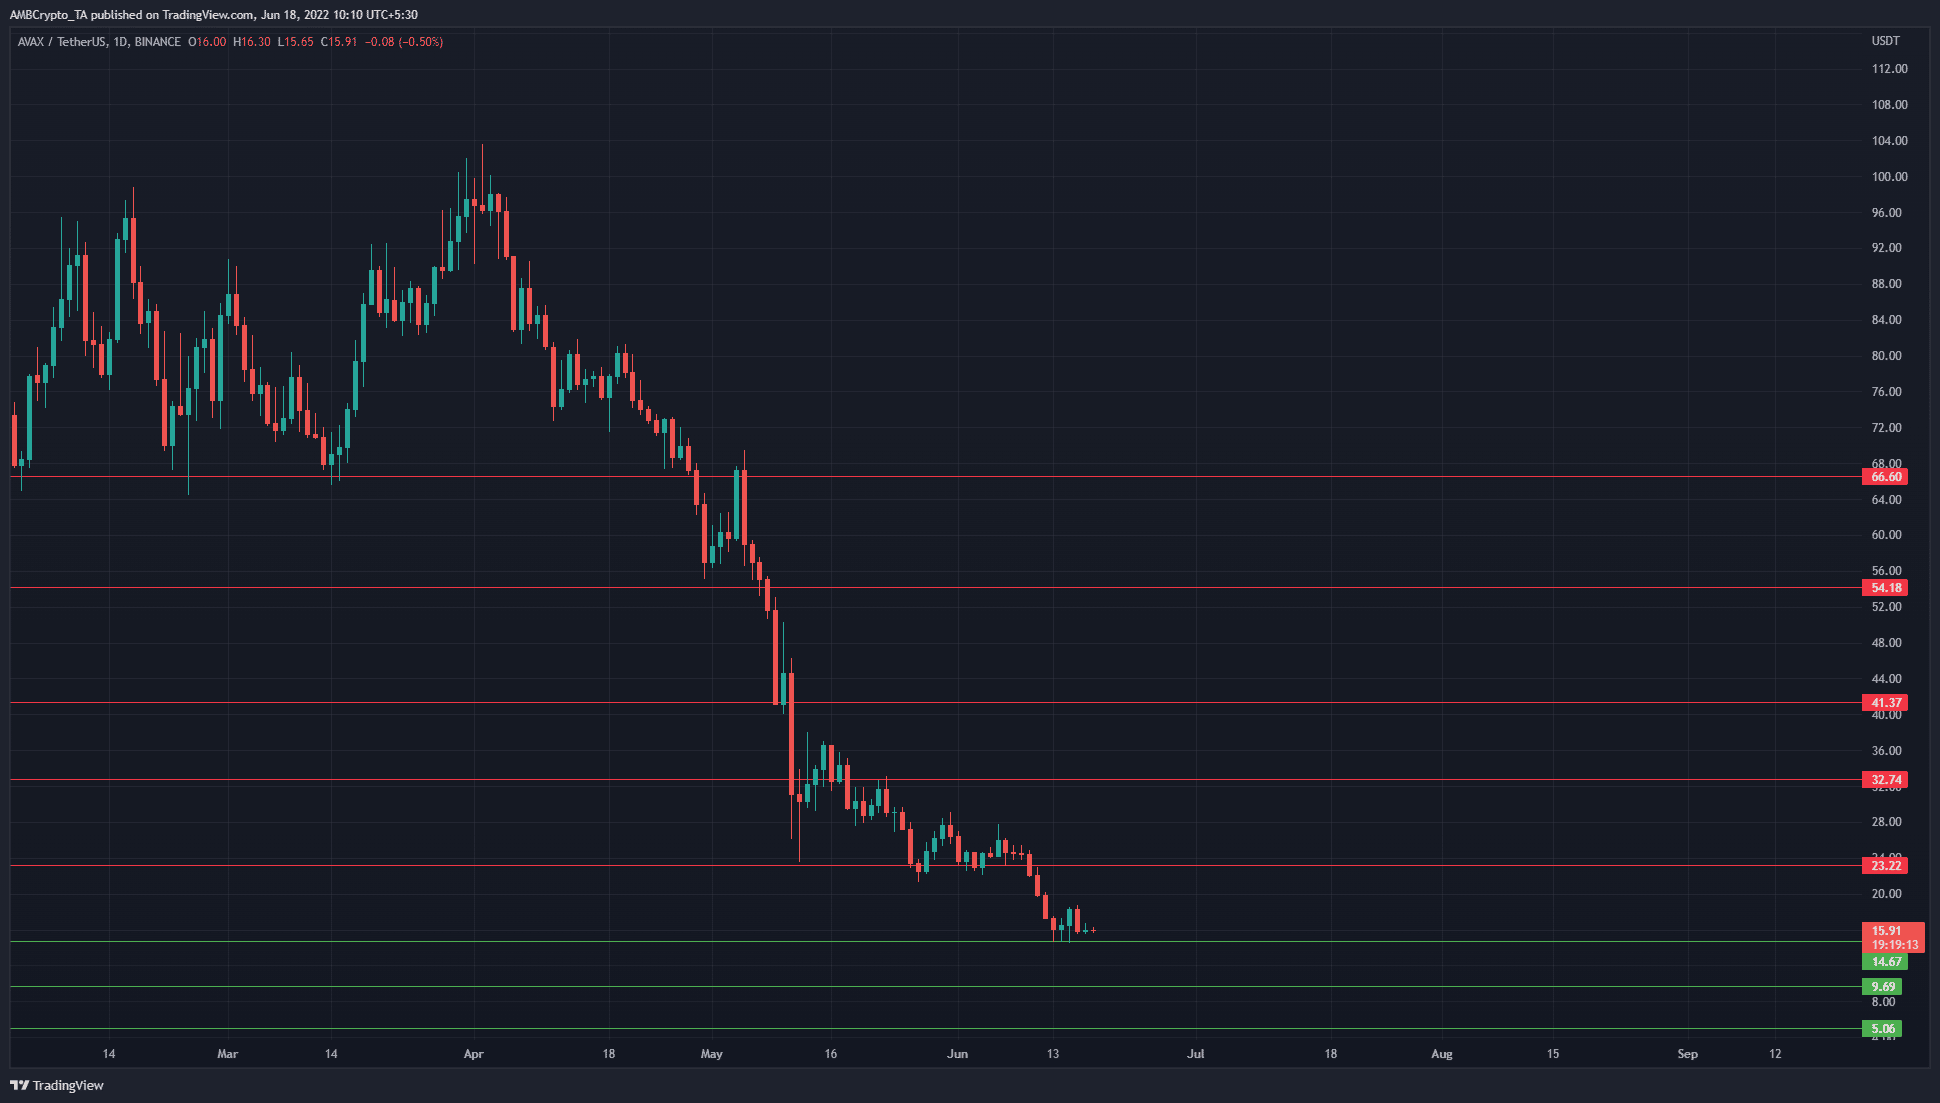
As mentioned earlier, AVAX has long-term horizontal support levels at $14.67 and $9.69. The previous support at $23.22 held for nearly a month, but the selling pressure was far too acute. Even on lower timeframes, a bullish bias was nowhere to be seen. The $20 and $18.8 levels were acting as short-term resistance levels.
The downtrend of AVAX began in late March. A rally from the $66.6 support level took AVAX as high as $103.2. In April and May, the sellers had control of the market, and AVAX has shed 84% since early April.
To flip the longer-term bias to bullish, AVAX would need to climb past the $28 mark. In doing so, it would also need to hold on to the $23 level as support.
On shorter timeframes, a move past $18.9 could flip the bias to bullish.
Rationale
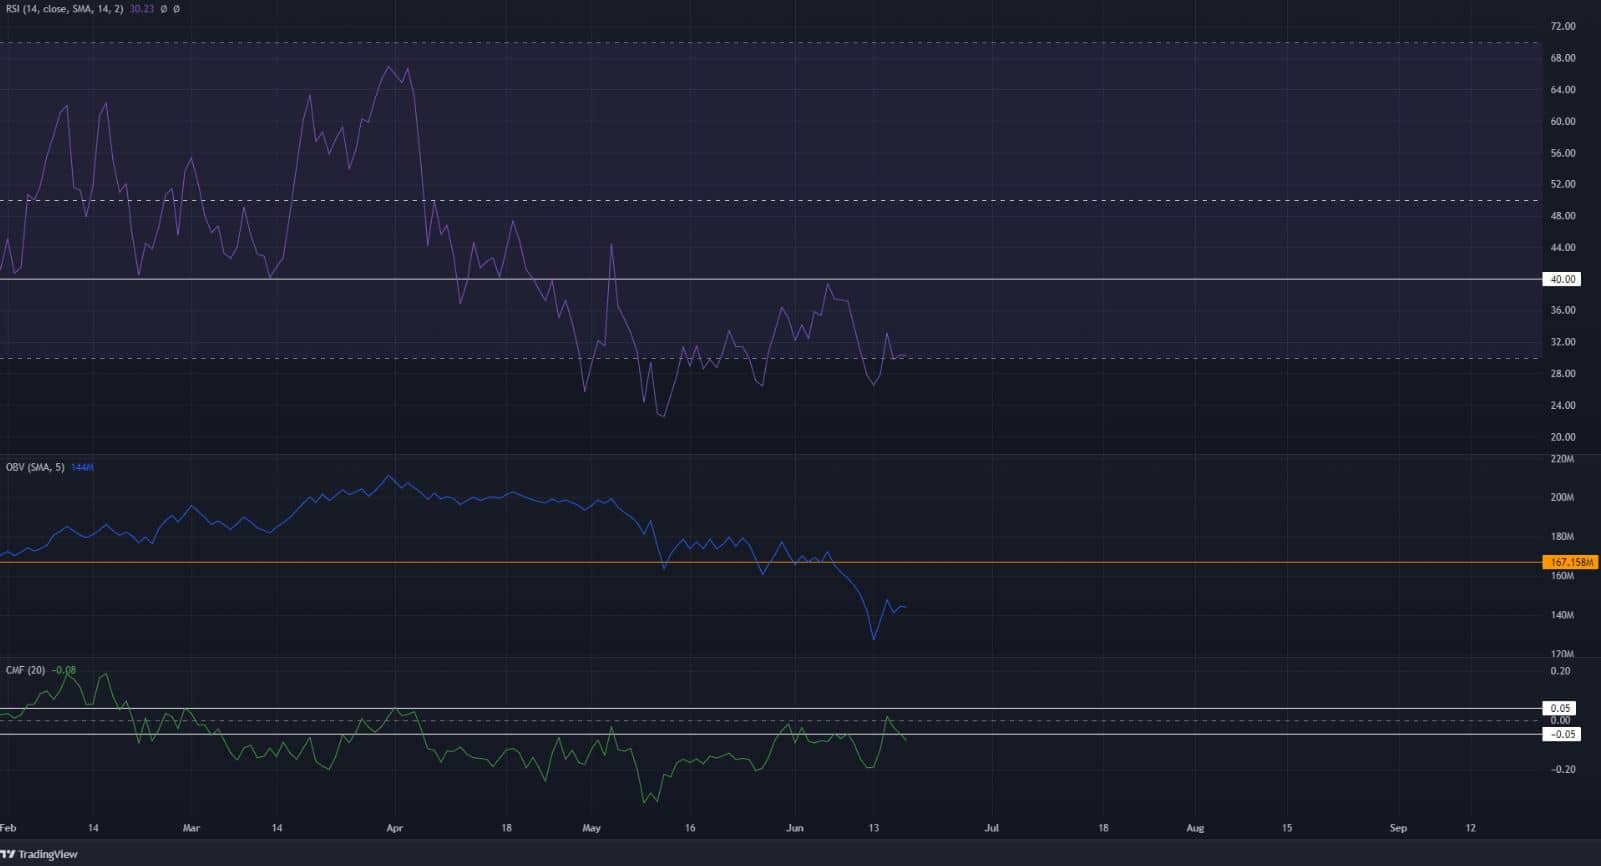
The daily RSI stood at 30.2 to show strong bearish momentum. It has been unable to climb above the 40 mark for nearly two months now. A bullish divergence was not present either.
The OBV also slipped below a level that it had held on to since February. The falling OBV suggested that selling volume was high, and the downtrend could continue unless the OBV can climb higher. The CMF has also been below -0.05 since April, with occasional forays to the zero mark. This signaled heavy capital flow out of the market.
Conclusion
Taken together, the indicators showed strong bearish momentum and selling pressure. A pullback toward $20 or $28 was not yet signaled. The market structure remained bearish as well. Hence, a session close below $14.6 could offer a shorting opportunity for Avalanche. At the same time, a move to $20, combined with a hidden bearish divergence, could also offer shorting opportunities.


