Avalanche: Watch out for a breakout over $82 from this bullish pattern
Disclaimer: The findings of the following analysis are the sole opinions of the writer and should not be considered investment advice
Avalanche has broken out of a descending channel recently and had a bullish outlook in the days to come. The trading volume behind AVAX was quite high in late February, touching the $600 million mark (for a 24 hour period) consistently during that short-term rally. This was accompanied by an increase in price for AVAX from $65 to $90. In the past few days as well, the trading volume has been picking up and touched the $400m and $600m mark. Alongside the increase in volume, a bullish chart pattern also appeared to be developing.
AVAX- 1H
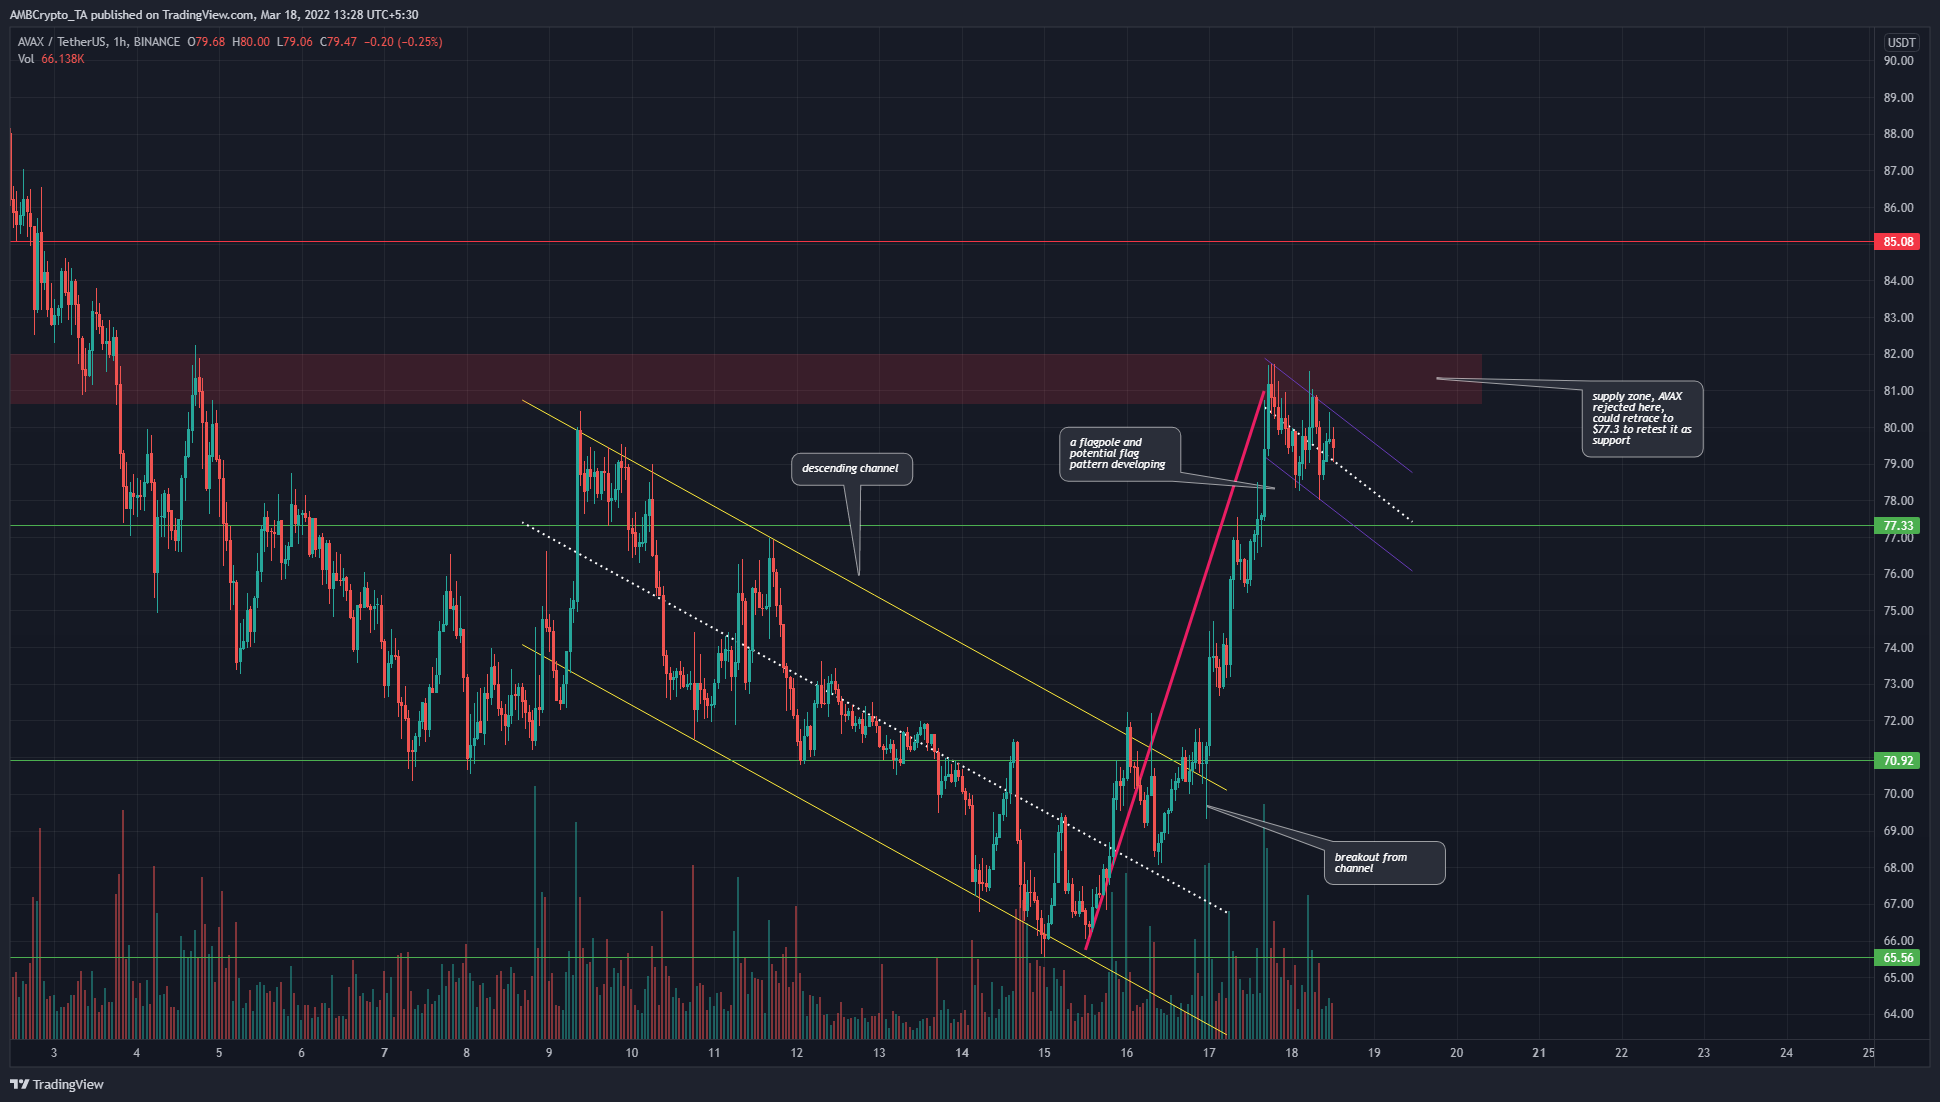
In the past few days, the price had been trading within a descending channel (yellow) and had broken out of the channel. A flag pattern appeared to form in the past couple of days. The strong surge from $67 to $81 formed the flag pole (pink) and the subsequent descent has formed a channel (purple) that is the flag of the pattern.
To the upside, the $81-$82 area (red box) has acted as a supply zone in recent weeks. Sellers have been quite strong in this area, and the next buying opportunity for AVAX could arise once this region is flipped from supply to demand.
Rationale
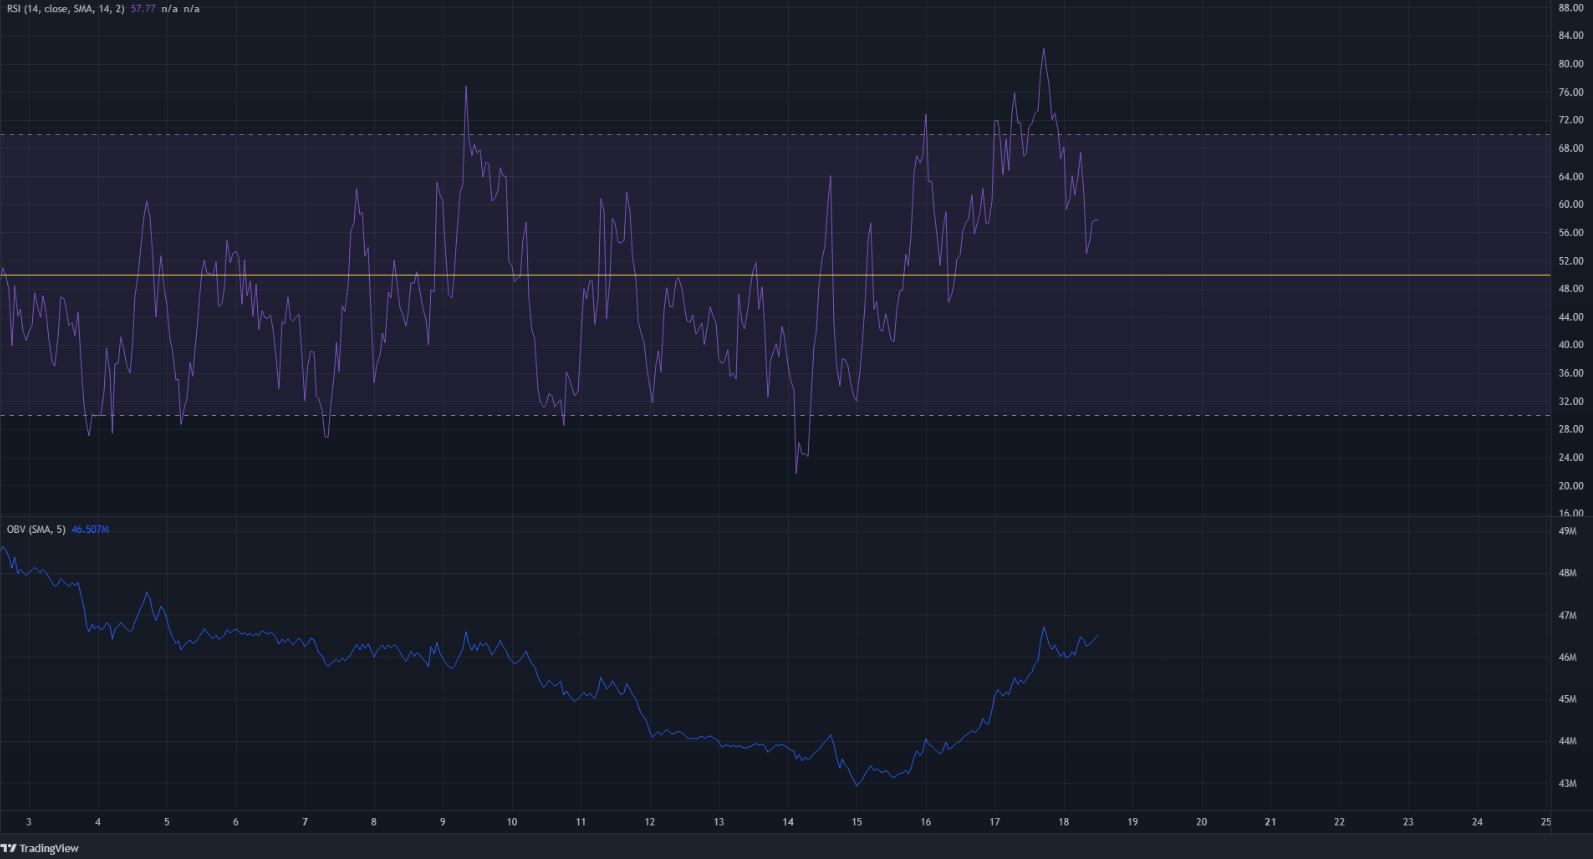
The RSI on the hourly chart stood at 57.7 and has shown strong bullish momentum in the past few days. The RSI’s drop from overbought territory back below the 60 value meant that momentum had reset on the lower timeframes and could see another leg upward soon.
The OBV has also been on a strong run upward recently. This was an indication that buying volume has outweighed selling volume in the past three days, and the rally was a genuine rally backed by steady demand.
Conclusion
A retest of the $77.3 level as support could be used as a buying opportunity. Alternatively, a breakout from the possible flag pattern, as well as a move past $82, could also serve as a trigger to look for entries for a long position on Avalanche.