Axie Infinity drops below $50, is this a bargain buy or is there more pain in store

A week ago the price of Axie Infinity stood at $75. However, even though there was a confluence of support levels right beneath $75 on lower timeframes at that time, the price crashed right through. This was not an isolated incident. The price of AXS has been steadily dropping, at times it has even dropped like a rock between levels of resistance to the next support, as selling pressure has been quite strong at times. At the time of writing, there was some support at the $45.18 level, with the price at $46.67 at press time.

The market structure on the 12-hour chart has been immensely bearish. The previous highs on the charts were not even approached in many instances. Long red candles are more of a norm than the exception in recent weeks for AXS, with many of the individual candles (12-hour sessions) representing double-digit percentage losses.
This reinforced the idea that demand was nowhere to be found for AXS. There was some decent demand at $92.5, and then once more, very briefly, at $70 in the past month.
At the time of writing, the price did bounce off the $45.18 level. However, there was no sign yet that a trend reversal was in sight.
In August, the price had compressed for a few days just beneath the $45.18 level. It had also bounced a couple of times between the $38 and $45 levels, and represented a pocket of liquidity.
In the next few days or a couple of weeks, a similar scenario could unfold. AXS could find some demand and possibly bounce higher from the $38-$46 area (yellow). At the same time, the more likely scenario to unfold appeared to be some sideways trading within this liquidity pocket, exhaust the buyers and force the prices even lower.
Rationale
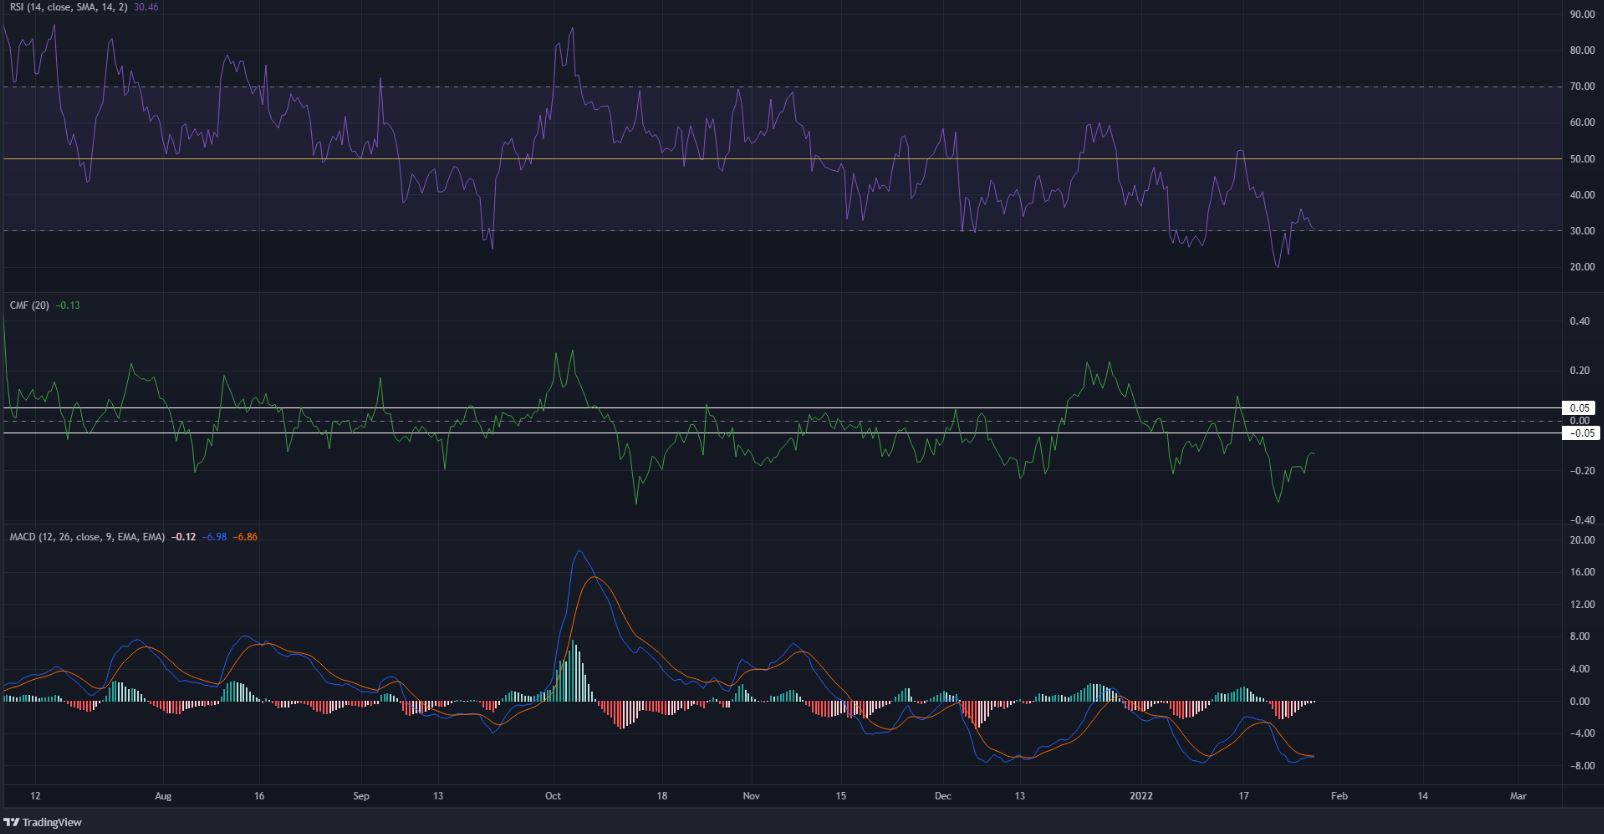
The indicators showed strong bearish momentum. The RSI on the 12-hour has been below neutral 50 for the most part of the past two months, which signified strong downward momentum. The RSI bounced from 20, which is a deeply oversold value, and was descending back toward oversold territory at press time.
The Chaikin Money Flow was beneath -0.05, to indicate significant capital flow out of the market. The MACD was also moving below the zero line, another show of bearish momentum interspersed by brief bounces. The 21-period SMA (orange) was also moving beneath the 55 SMA (green).
Conclusion
An oversold RSI combined with a longer-term demand area could see a brief bounce for AXS from the $40 zone. However, the market structure continued to point decisively downward.


