Axie Infinity’s August NFT performance ushers in this fatality

Before there was so much buzz about NFTs, Axie Infinity [AXS] was the market king. As a result, AXS generated billions of dollars in sales volume.
However, the decline of AXS digital collectibles has been disappointing. In August, AXS NFT volume slightly went above $5 million. According to CryptoSlam, this was a better performance than its records in the preceding month of July.
All the facts
The drop in volume was the fourth time recorded sales were below double digits. The last time there was an eight-figure count was in April, when sales hit $19 million. May came, and it was $7 million, while June sales were approximately $3.20 million.
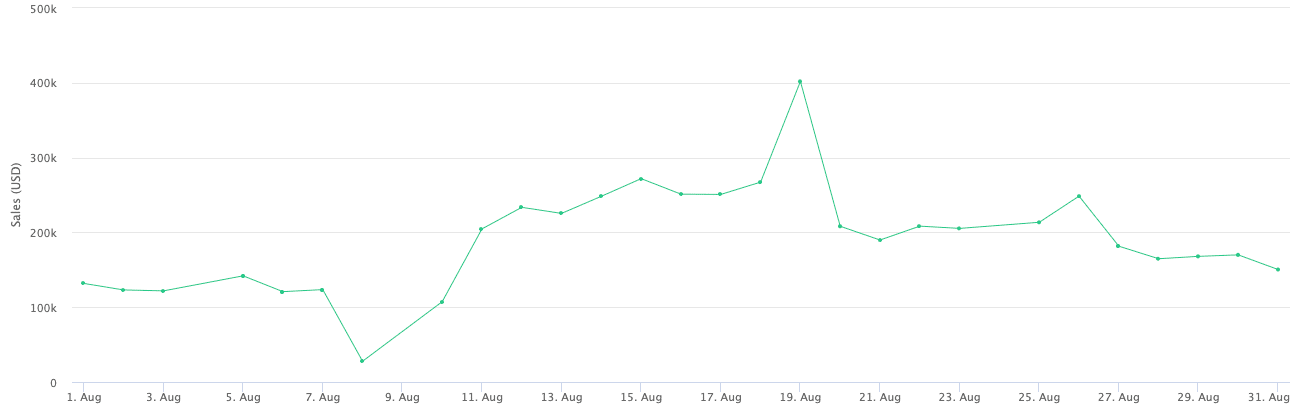
Based on the data available at press time, there were only 339,921 transactions at an average price of $13.41. The buyers who participated in these transactions also capped at 44,558. Unfortunately, this was the first time AXS recorded such low involvement in over fifteen months.
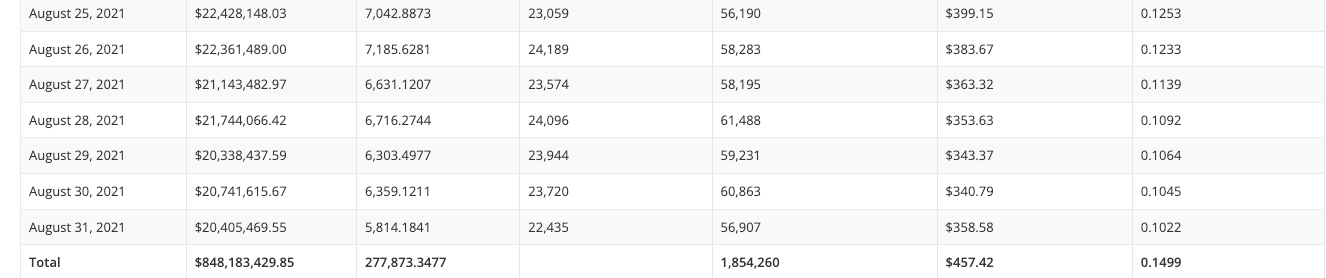
The losses did not stop at that. A look at the August 2021 volume showed that AXS reached $848.13 million in sales, which involved 1.85 million transactions at an average price of 0.0078 ETH ($457.42).
So AXS lost over $800 million in Year-on-Year (YoY) sales. Maybe the bearish state of the crypto and NFT market had an impact, but the fall-off has proven to be massive compared to other major NFT protocols.
Where has this left AXS?
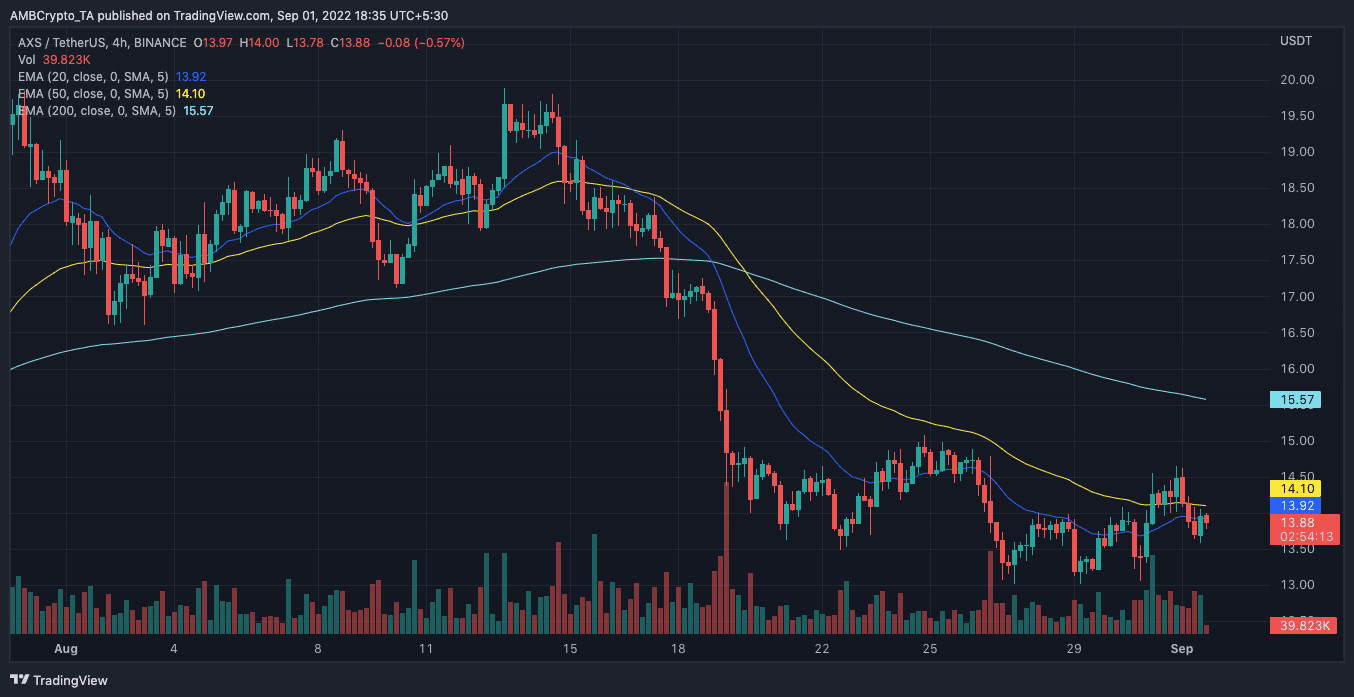
Like its digital collection, the AXS cryptocurrency also failed to excite its investors and the crypto community. For August, AXS did not get up to $20 per token.
According to CoinMarketCap, AXS was trading at $13.86. Additionally, its 24-hour trading volume was down $104.06 million, which accounted for a 21.61% drop.
For AXS HODLers, the road to recovery might be longer than projected. This is because the indications from the Exponential Moving Average (EMA) showed that there was highly high selling pressure.
According to the charts, the 20 EMA (blue) was well below the 50 EMA (blue). With this, hopes for a bullish movement in the short term could be over.
It is a similar situation in the mid to long term as the 200 EMA (cyan) also maintained its positive above the 20 EMA and 50 EMA.