Binance Coin: A safer bet would be to make this move

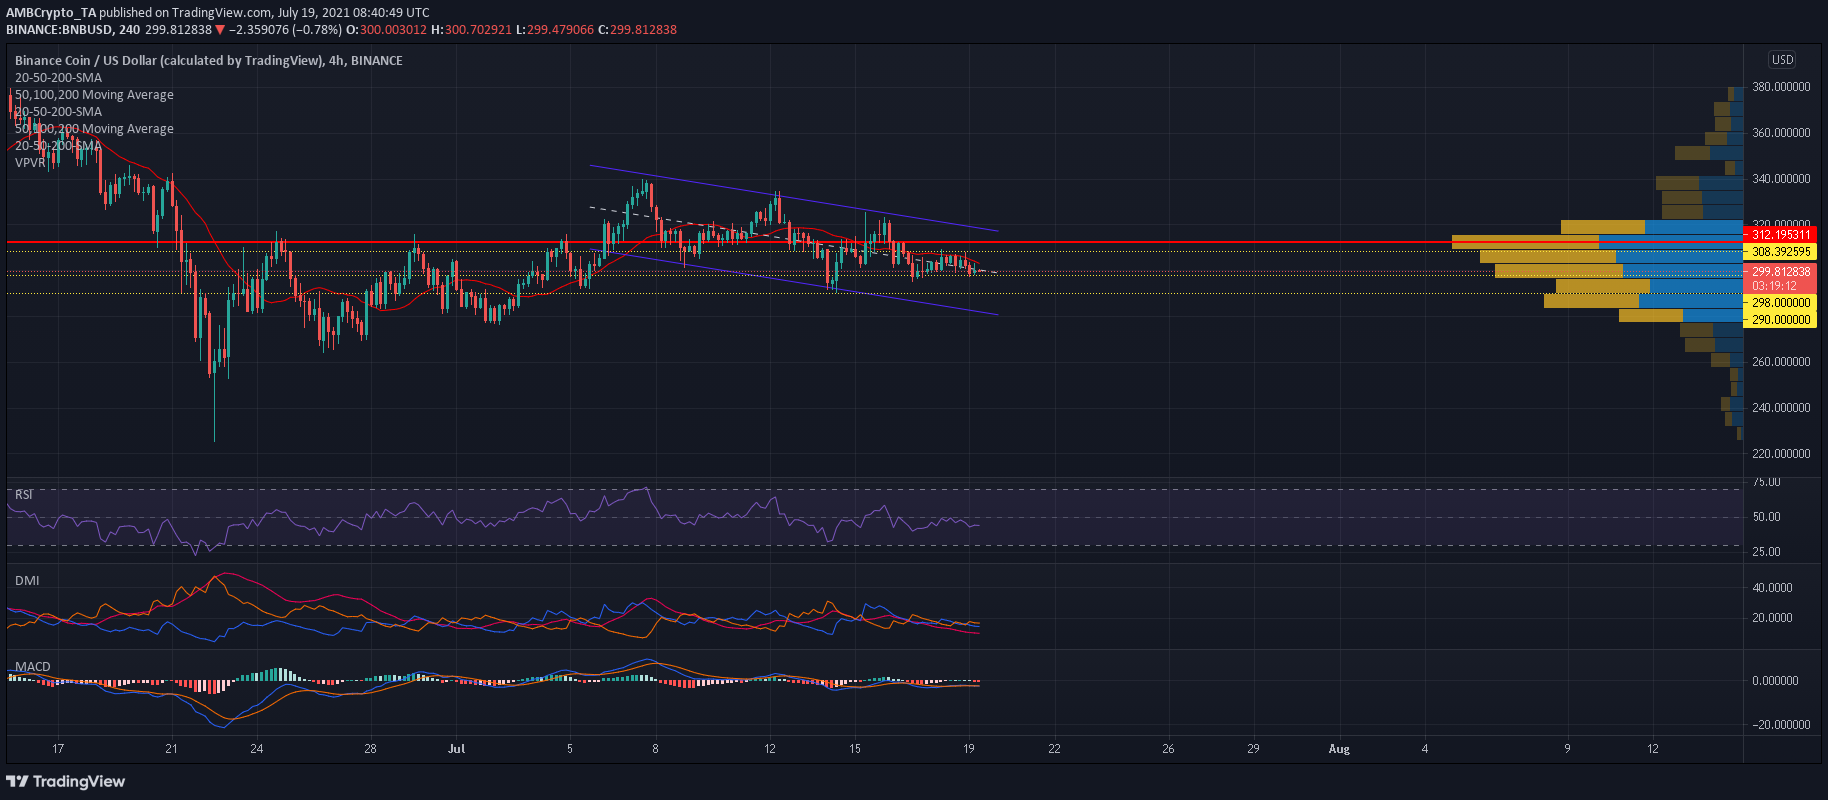
Like most altcoins in the market, Binance Coin was witnessing a period of stagnation on the charts. Its value oscillated between $296-310 over the past few days, with neither bulls nor bears able to assert dominance. At the time of writing, BNB traded at $300, down by 1.1% over the last 24 hours.
Binance Coin 4-hour Chart

Source: BNB/USD, TradingView
After touching a high of $340 in early July, Binance Coin’s value gradually declined within the confines of a down-channel. Bears eventually tested the $290-support mark but a breakdown was avoided- a development that led to a rally of nearly 13% towards the upper trendline of the pattern. Since making this move, BNB has mostly traded at the mid-point of its pattern and remained in a state of equilibrium.
Reasoning
Directional Movement Index’s -DI and +DI lines were in close proximity which showed the lack of a clear trend in the market. Moreover, ADX clocked in at 11 which invalidated chances of a large price swing over the coming sessions. MACD’s Fast-moving and Signal lines were also intertwined, and the histogram noted weak momentum in the market.
Meanwhile, the Relative Strength Index has moved between the bearish-neutral zone of 40-50- a finding that showed the lack of sustained buying pressure. Considering the presence of a weak trend, BNB could resume its sideways movement till a stronger trend emerged in the broader market. The 20-SMA (red) ran bearish and could prevent any short-term upside, whereas a support mark of $298 could contain incoming losses.
Meanwhile, market observers must be mindful of a close below the $290-280 range. Visible Range showed a lack of strong support levels below this region and a breakdown could trigger sharp retracements in the market. Conversely, bullish moves would likely be contained at a strong resistance mark of $315, which also coincided with the Visible Range’s point of control.
Conclusion
BNB’s indicators failed to identify a clear trend and prices could trade sideways and between $298-305 over the coming sessions. If bullish cues emerge in the altcoin market, BNB’s next destination would likely be at its $315 price ceiling, however, chances of a breakdown cannot be overlooked as well. Placing any trades in the market could be risky at the moment and a safer bet would be to wait for BNB to reach a more critical resistance/support mark before opening a long or short position.


