Ethereum: When is this the right time to enter the market?

Ethereum, the market’s largest alt, has been quite averse to any dramatic price action over the past few days. However, at the time of writing, the broader market seemed to be recovering from its losses and its capitalization was up by close to 3% in the past 24-hours. The same was reflected in the one-day RoI of most of the coins, including Ethereum.
In the crypto market, a majority of retail investors are usually bullish. Now, this gives rise to an interesting battle between the market’s long and short participants.
Ethereum’s aggregated liquidations, interestingly, touched a new high on the 3-day chart. This essentially implies that contract holders were exiting the market at a loss. At the time of writing, the number of long liquidations exceeded the number of short liquidations by a fair extent. Generally, such a move does no good for the price.
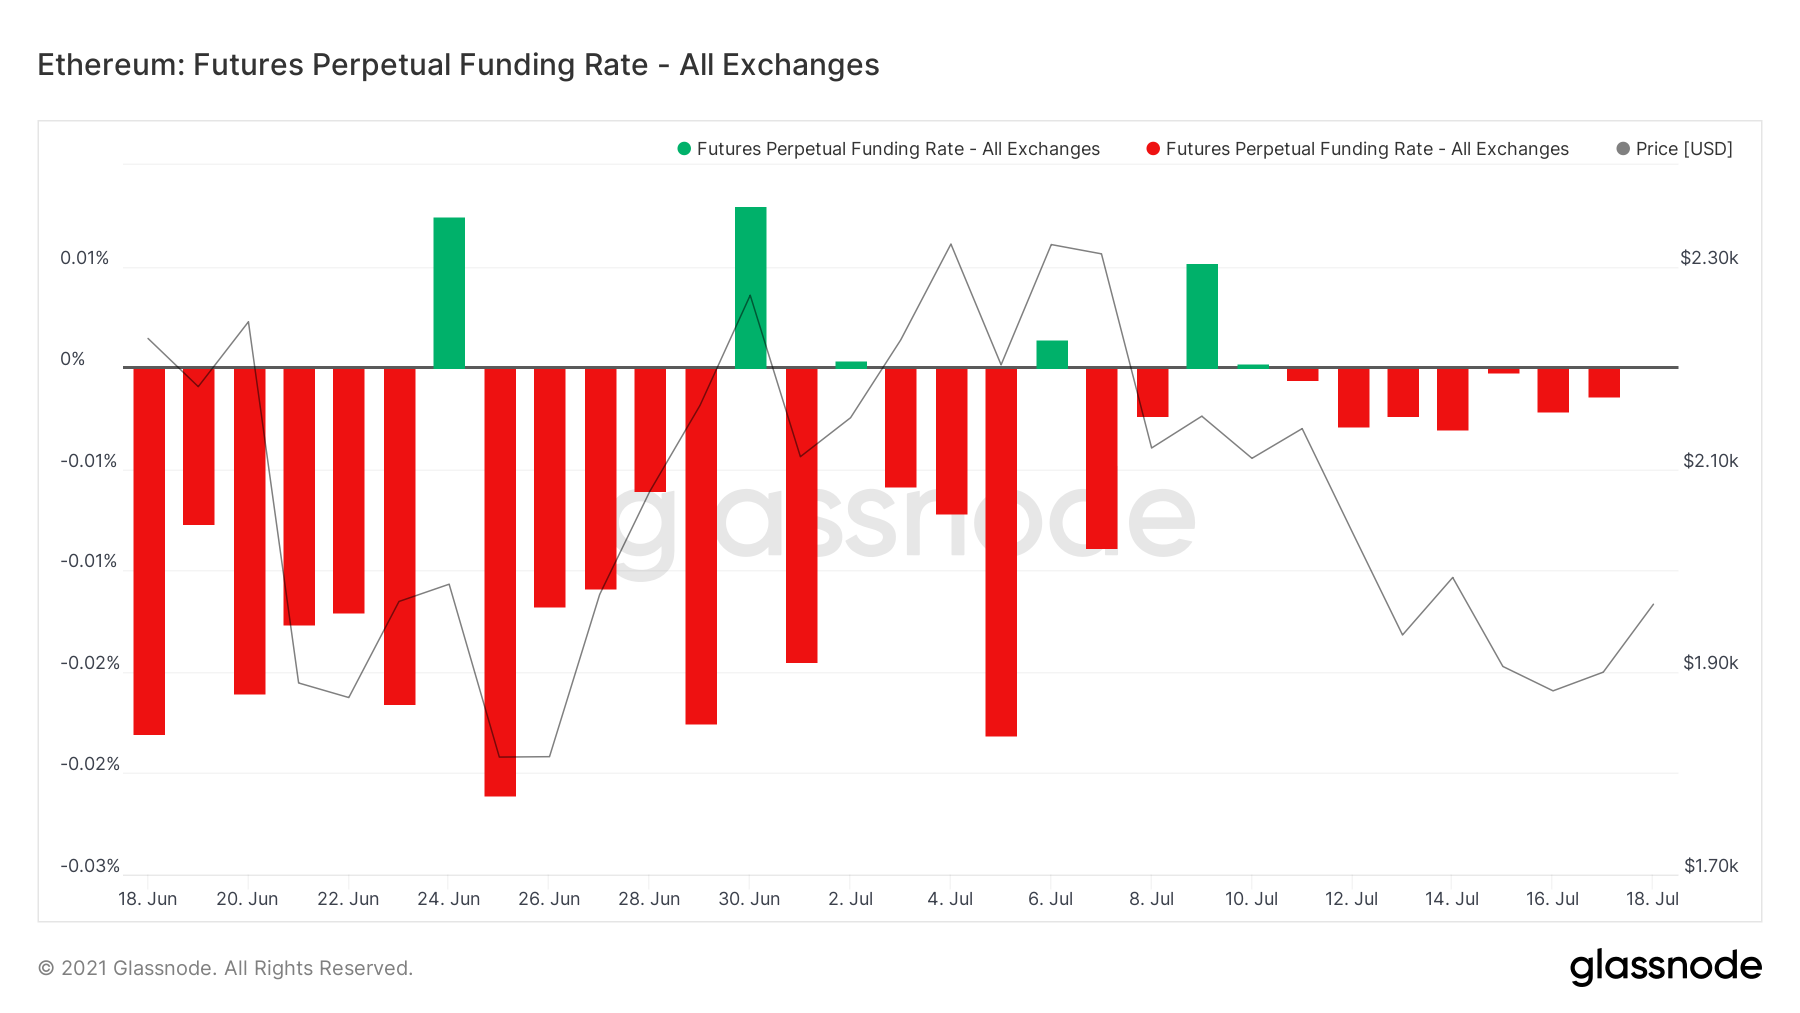
Let’s consider the futures perpetual funding rate for starters. Unlike regular monthly contracts, the price of perpetual futures is quite congruent to the price at regular spot exchanges. Now, this saves the burden of rolling over positions near expiries and calculating the futures premium.
So, whenever shorts are over-leveraged, the funding becomes negative and they (sellers) become the ones paying the fee to long position holders. Well, this is typically the situation that ETH was in for the most part of the month.
A negative funding rate, arguably, throws a safety net towards the buyers as there are incentives in place to gather strength and try to squeeze the short-sellers. However, as soon as shorts close their positions, the situation would tend to balance itself and the funding rate would get neutralized. At the same time, it should be noted that this opportunity is usually short-lived. Hence, at the moment, this can be considered to be a buy signal.
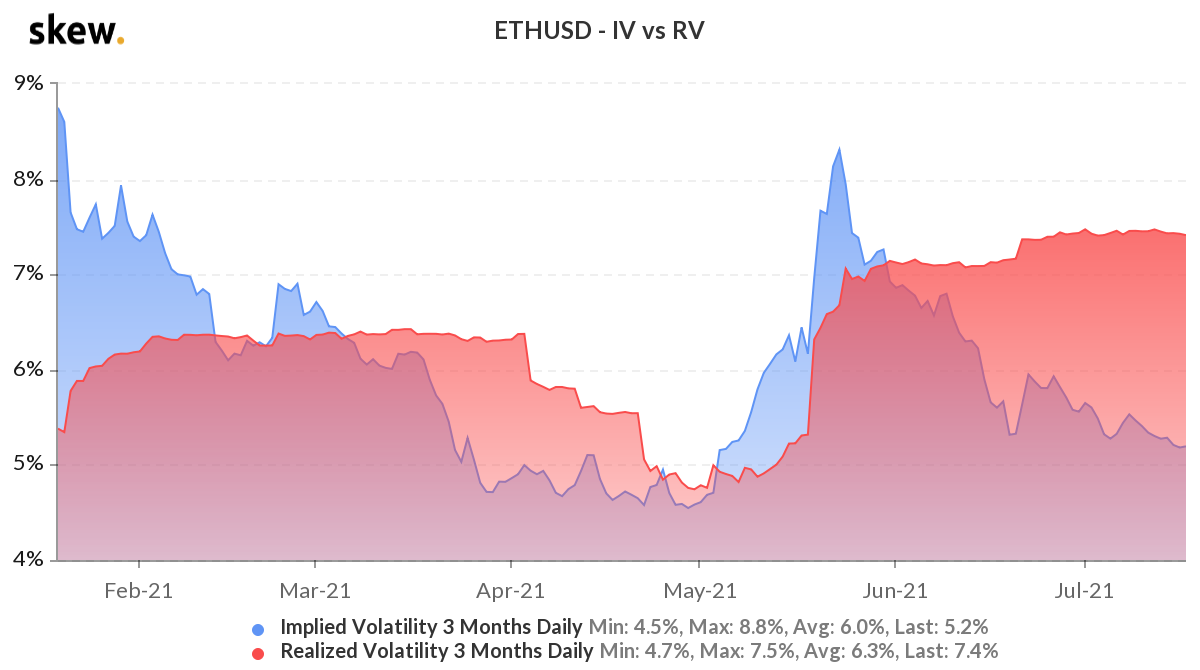
The alt’s Implied Volatility v. Realized Volatility spread painted another interesting picture. As a matter of fact, implied volatility (IV) represents the fair value of volatility based on the market’s expectation, while the realized volatility (RV) is the actual volatility present in the market at a given point in time. As depicted in the chart attached, over the past few weeks, the RV has completely overshadowed the IV.
Notably, from 25 April to May 15, when ETH’s price kept breaking new ATHs, the difference between the realized volatility and implied volatility wasn’t that stark. Similarly, during other past uptrends as well, both IV and RV, to a fair extent, moved hand-in-hand.
Ergo, for ETH to enter into a bullish zone at this stage, a simultaneous increase in the IV is required. However, the highly volatile environment at the moment has the potential to compel traders to re-enter their positions. This, in turn, could possibly provide the ETH market a temporary respite.