Binance Coin, Bitcoin Cash, Decentraland Price Analysis: 26 November

The global crypto market suffered substantially as it reached the $2.5T-mark. Most cryptos furthered their bearish swing while bullish power plummets. As a consequence, Binance Coin, Bitcoin Cash and MANA saw double-digit losses over the past day.
Binance Coin (BNB)
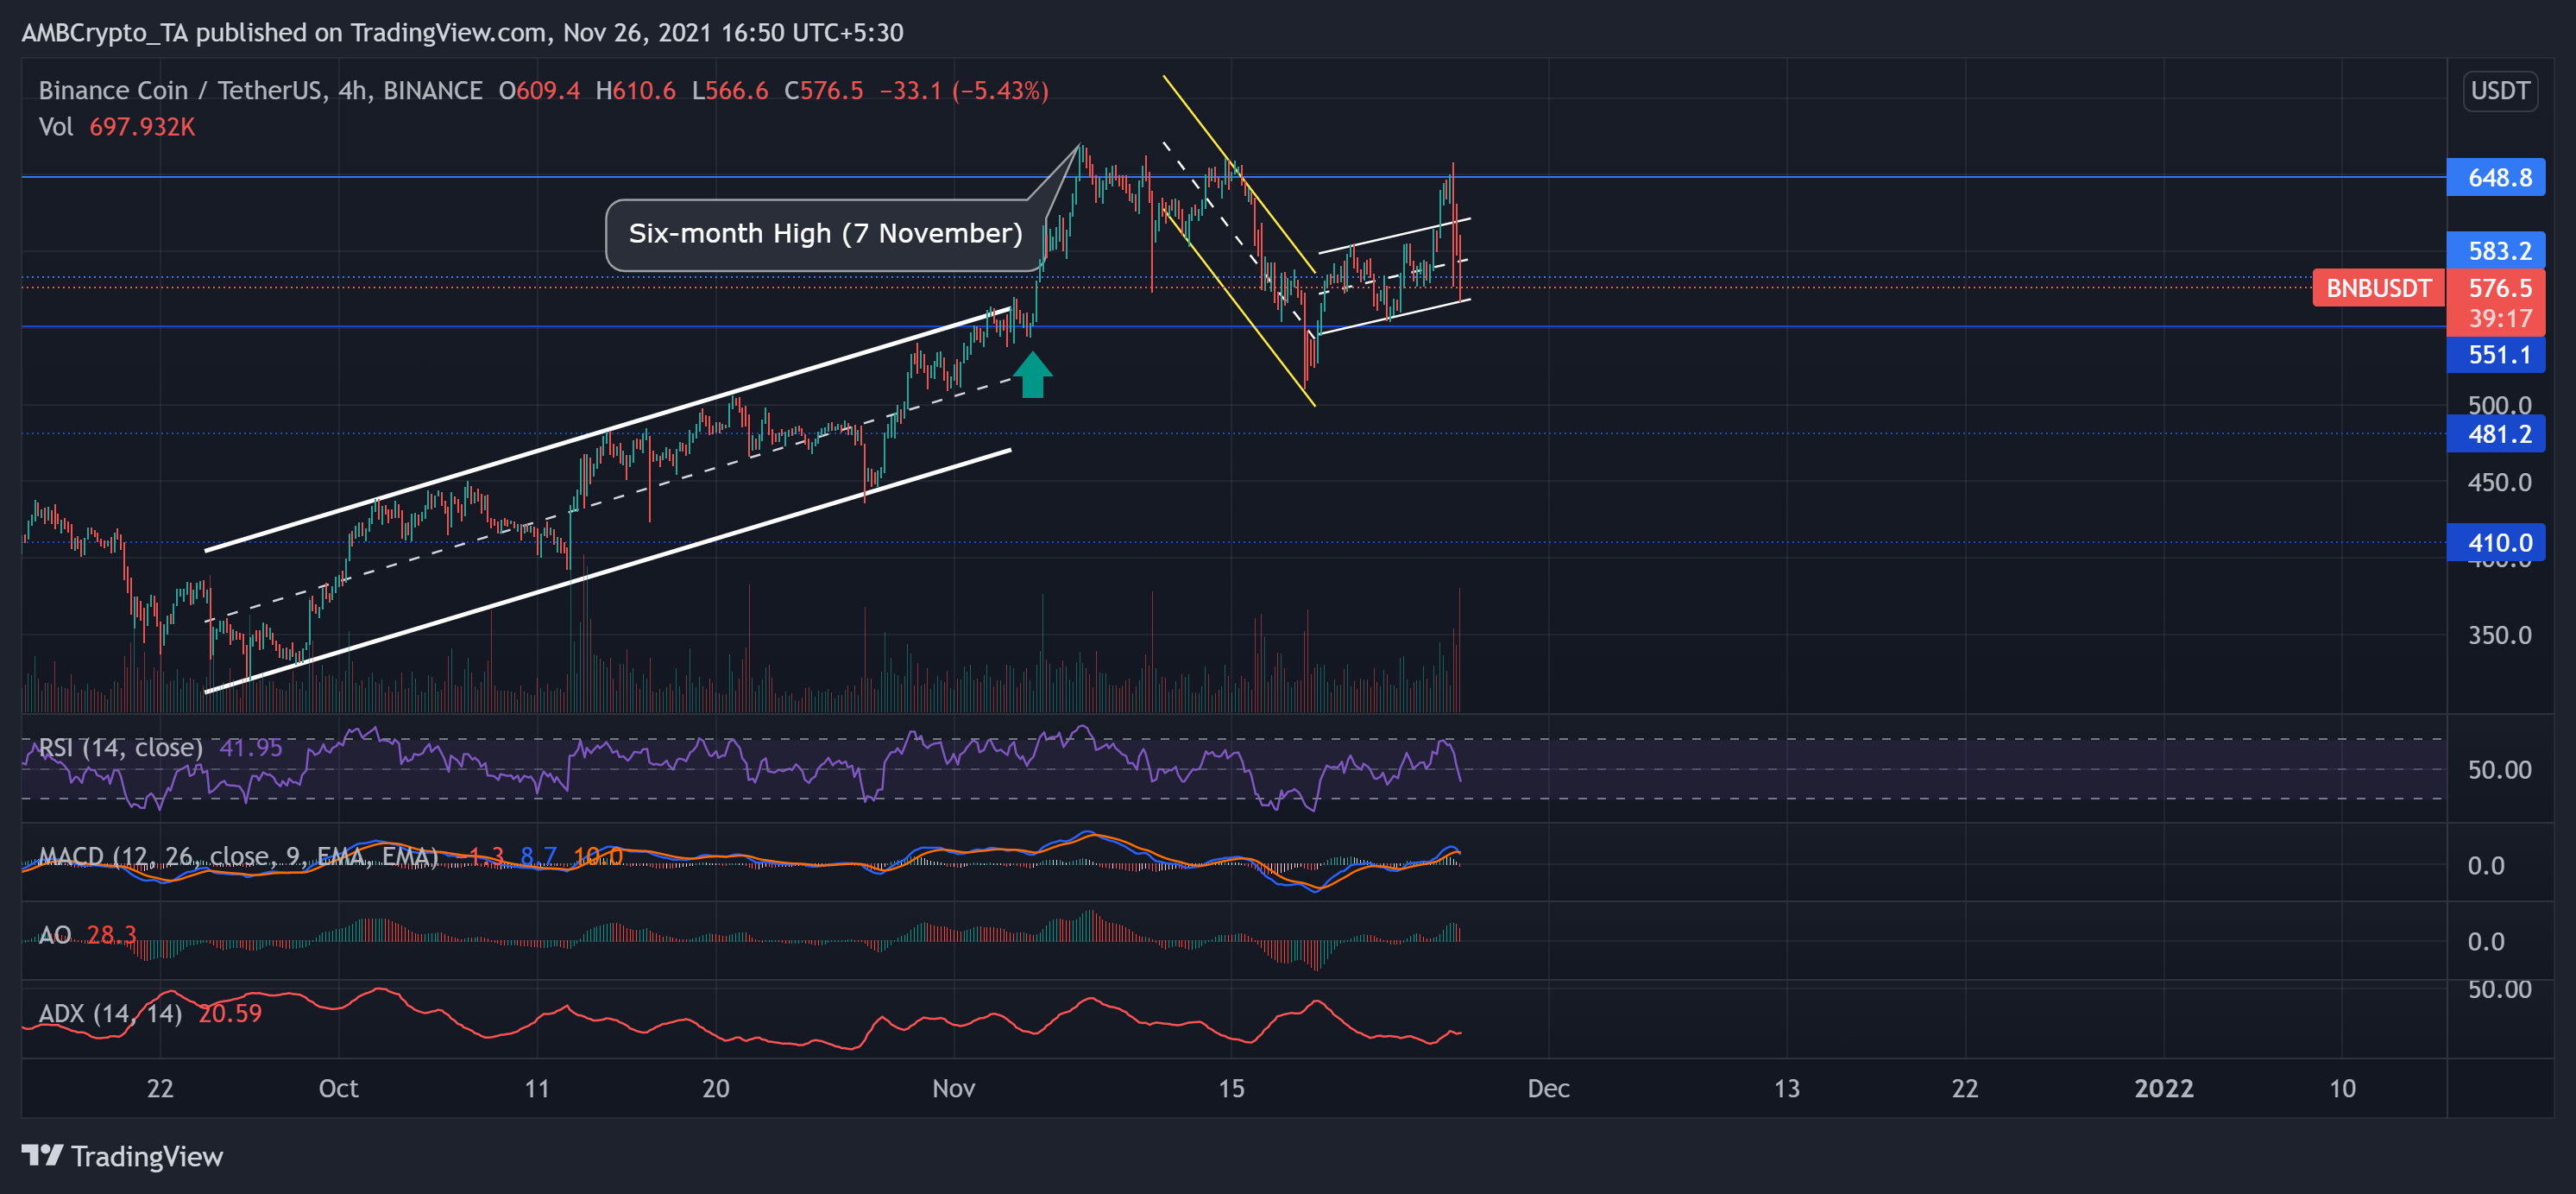
BNB consistently marked higher lows regardless of the market tendencies. After a monstrous 78.41% rally in 39 days (from 24 September), BNB price action touched its six-month high on 7 November.
Nevertheless, the bears historically ensured resistance around the $648-mark. Then, the price action witnessed a 22.8% pullback until it touched its two-week low on 18 November. After which, the bulls were quick to respond and keen on sustaining their long-term advantage. As a result, the price inclined in an up-channel since the past week.
However, the alt noted a 10.8% decline in just 24 hours. At press time, BNB traded at $576.5. The RSI saw a steep plunge as it witnessed a 26 point decline over the past day. Further, the AO and MACD visibly point at the decreasing bullish power. However, the ADX displayed a weak directional trend.
Bitcoin Cash (BCH)
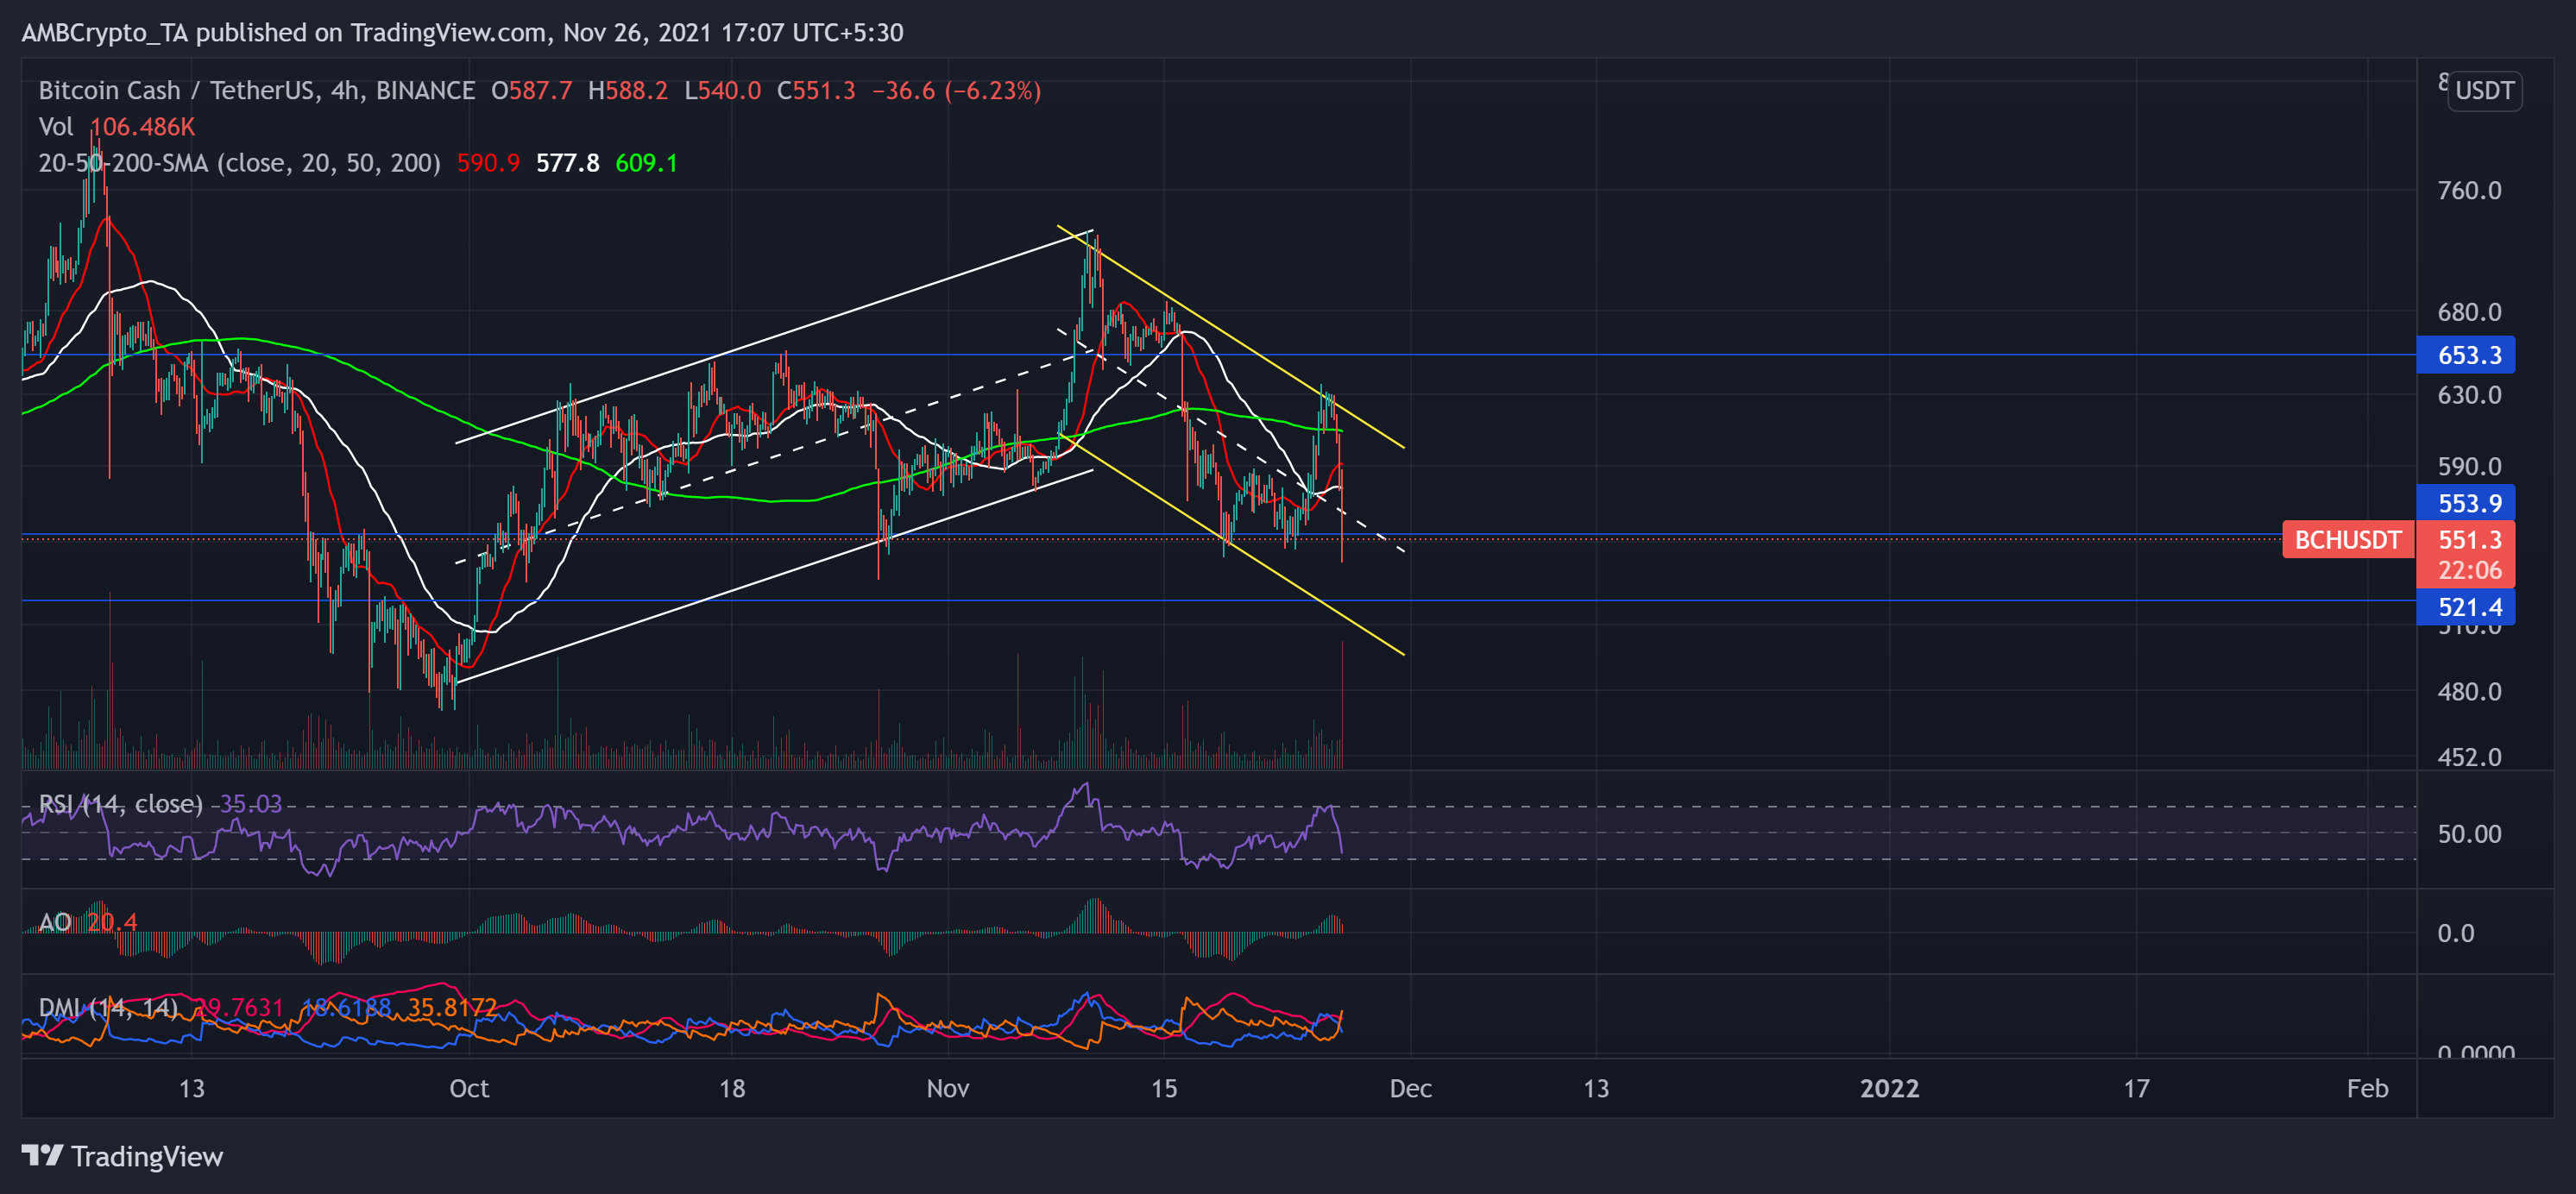
BCH couldn’t continue a sustained October bull rally. After a 46.9% October and early November ascent, the altcoin touched its nine-week high on 10 November. However, the bears showed resistance at the upper channel. They initiated a 25.69% retracement as BCH hit its four-week low on 26 November.
The altcoin showed promising revival signs as it recovered from the slump. Still, BCH noted an 11.4% loss in just 24 hours and continued its downtrend. Over the past day, BCH bulls struggled to find support at the $553-mark. Also, they initiated a downswing on increasing trading volumes.
As a result, the price traded below its 4-hour 20-50-200 SMA at $551.3. The RSI plunged from the overbought region to the 35-mark within the past few hours and showed no revival signs. Further, the DMI confirmed the bearish vigor while the AO approached equilibrium.
Decentraland (MANA)

As play-to-earn and Metaverse tokens continually propel, MANA noted its lifetime milestone on 25 November. After over a 500% rally and striking its then ATH on 31 October, the token formed a descending wedge pattern.
The withdrawal resulted in nearly 45% retracement until the bulls took over on 11 November. This bullish revival caused a descending wedge breakout and transposed into an up-channel (yellow). Consequently, the metaverse alt registered a staggering 126% ROI from 11 November to 25 November and touched its ATH.
Nevertheless, it becomes crucial to note that MANA couldn’t gather increased trading volumes in the past month. Over the last day, MANA saw a 15.44% decrease.
At press time, MANA traded at $4.5129. The RSI dipped from the overbought region to the half-line after assuming a southern tendency. Even so, the DMI flashed neutral sentiments with a slight bullish preference.


