Binance Coin, Bitcoin Cash, Litecoin Price Analysis: 06 July

Many market altcoins opened with a bearish outlook on 6 July. And yet, BNB climbed back above the $300 level finally.
The market capitalizations of Bitcoin Cash and Litecoin noted declines of 9.11% and 9.06%, respectively. While Bitcoin Cash recovered from its price slump, on the trading charts, it pictured a lot of bearish momentum. Finally, Litecoin demonstrated a fall in buying pressure across the market at press time.
Binance Coin [BNB]

Binance Coin continued to see sideways movement, trying hard to break past the $340 resistance level. BNB’s closest support level continues to be $254. The altcoin also hiked by 2.1% in 24 hours. Binance Coin showed some signs of recovery as it rebounded from the $254 support level and finally traded above the $300 level.
Across its trading indicators, bearish signals were seen for a while, with the Awesome Oscillator noting the same on 5 July. On the back of recent price recovery, however, some bullish signs were seen too. With the crypto still largely range-bound, buying pressure finally crept up because capital inflows have been on the rise over the last couple of days, as spotted by the Chaikin Money Flow.
The Bollinger Bands were parallel, but with some convergence hinting at no steep price action over the next few trading sessions.
Bitcoin Cash [BCH]
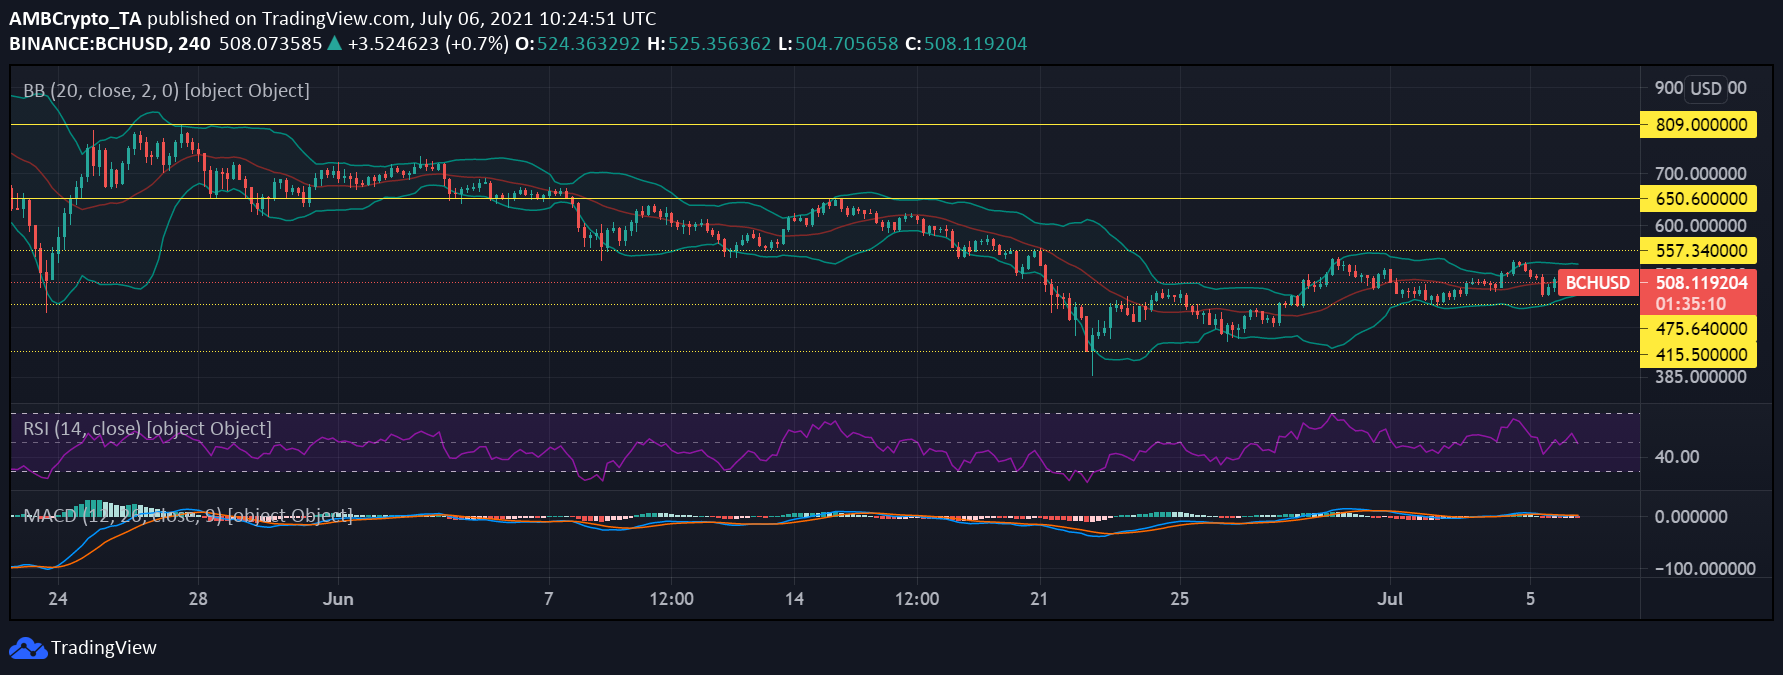
BCH’s price action has been sandwiched between the $475 and $555 levels since the last week of June. Just as any other coin, due to broader market weakness, the asset too saw a slump and despite recoveries, the token still had bearish tendencies at press time. If backed by substantial bullish pressure, then the coin can attempt to move above the $555 resistance. In case of a further dip, the altcoin could easily rest on the support level of $475 soon enough.
The Bollinger Bands were closing in, with the likelihood of sharp price action in the near term low. The Relative Strength Index continued to stay close to the neutral zone, but at press time, the buying pressure did note a little fall.
A bearish crossover on 5 July marked the onset of increasing bearish momentum as the red histogram on the MACD indicator seemed to extend itself at press time.
Litecoin [LTC]
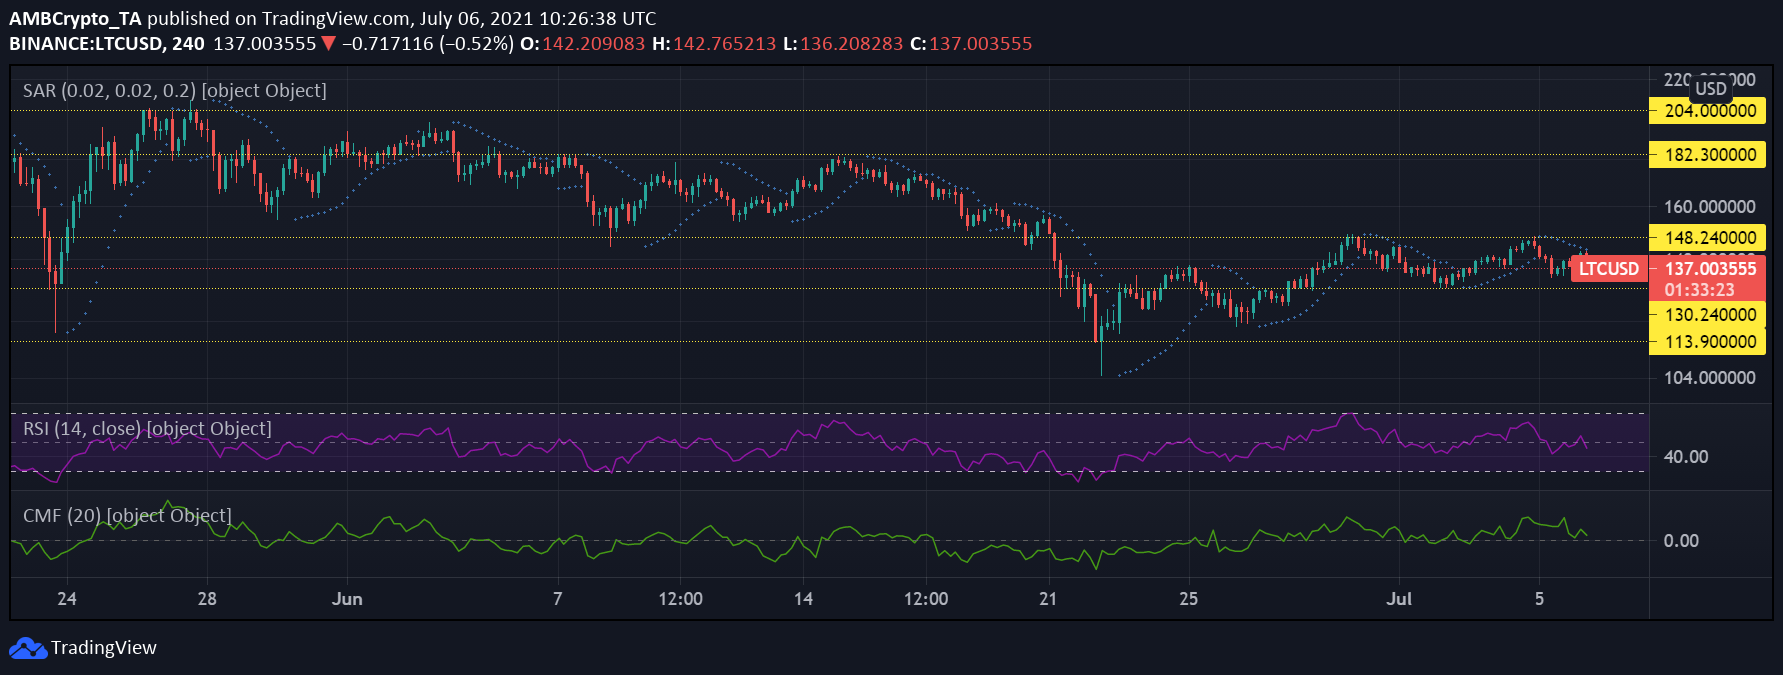
At the time of writing, Litecoin had fallen by 3.1% in 24 hours. The alt reversed the gains that it noted over the last few days, and if the coin doesn’t pick up momentum, it is only a matter of time till it touches the $130.24 support level again. If the asset moves up north, then it seemed likely that it could break through its $148 resistance levels as it already had tried testing this level twice over the last week or so.
The Relative Strength Index saw a fall in buying strength in the market as the indicator dipped towards its median line. This reading meant sellers had increased, at press time. The Chaikin Money Flow validated the same as the indicator observed a fall in capital inflows over outflows.
Litecoin’s decline in price corresponded with the Parabolic SAR’s dotted lines above the candlesticks, a finding which signified that the digital asset was on a price downtrend at the time of writing.