XRP, Cardano, Binance Coin Price Analysis: 05 July

After Bitcoin rejected the price level close to $36,000 and crumbled, the altcoins followed suit. The spot market appeared to be driven by high bearish volatility, however, trends may change in the long-term .
XRP, Cardano [ADA], and Binance Coin [BNB] markets were also volatile which could be a result of a breakout or an upcoming price swing.
XRP

The 12-hour chart of XRP was moving within an ascending triangle pattern. This price action formed higher lows, whereas the high remained consistent at $0.7079. As the price continued to rise within this pattern, it may be looking at a breakout, pushing the value of the asset to $0.7928.
However, volatility reduced as Bollinger Bands converged. The market was bullish, which could help the price to break out. Despite the evident bullishness, selling pressure in the short-term was pushing the bears into the long-term market. This could lead XRP’s price to breakdown.
If the price breaches the slope of the ascending triangle, it may be looking at a drop of 13% to $0.67. Meanwhile, Awesome Oscillator showed high momentum in the market and Stochastic RSI remained overbought, at press time. Selling pressure could cause the XRP market to achieve stability.
Cardano [ADA]
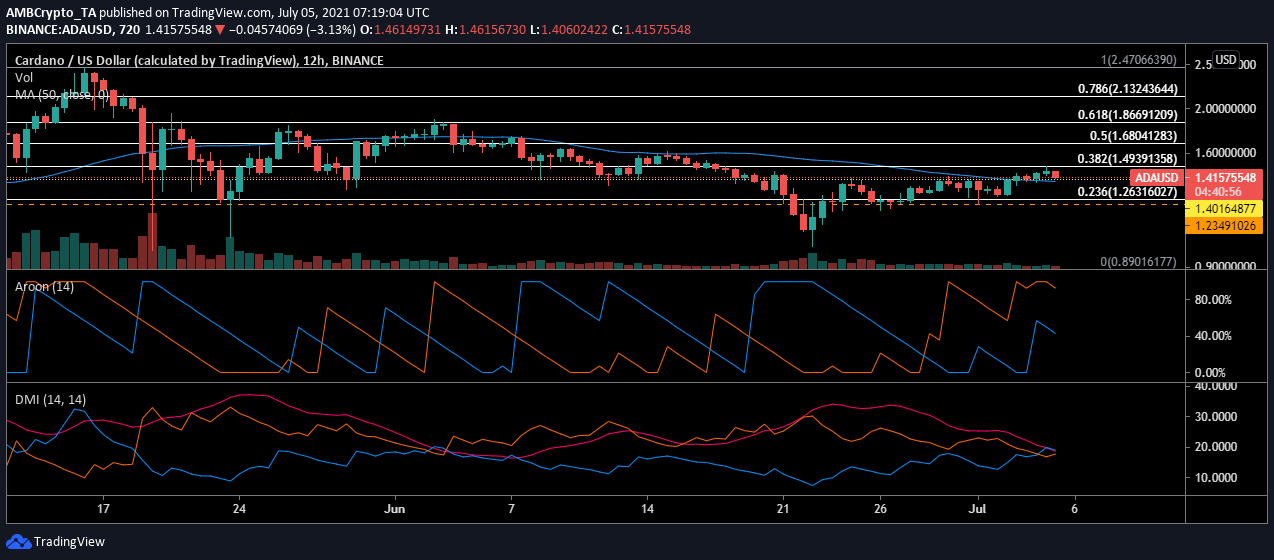
The Cardano price had climbed above resistance at $1.40. This surge was supported by a rising buying pressure for the asset. This price increase pushed the 50 Moving Average under the candlesticks, causing the trend change to a bullish one.
The same was affirmed by Aroon indicator as the up line was above the down line, signaling high support for an uptrend. The price may continue to trade above resistance as buying and selling continued. However, Directional Movement Index suggested a trend reversal making its way into the ADA market. The +DI, which highlighted the strength of the buying pressure, may cross under the -DI, which could trigger selling of the asset.
Binance Coin [BNB]
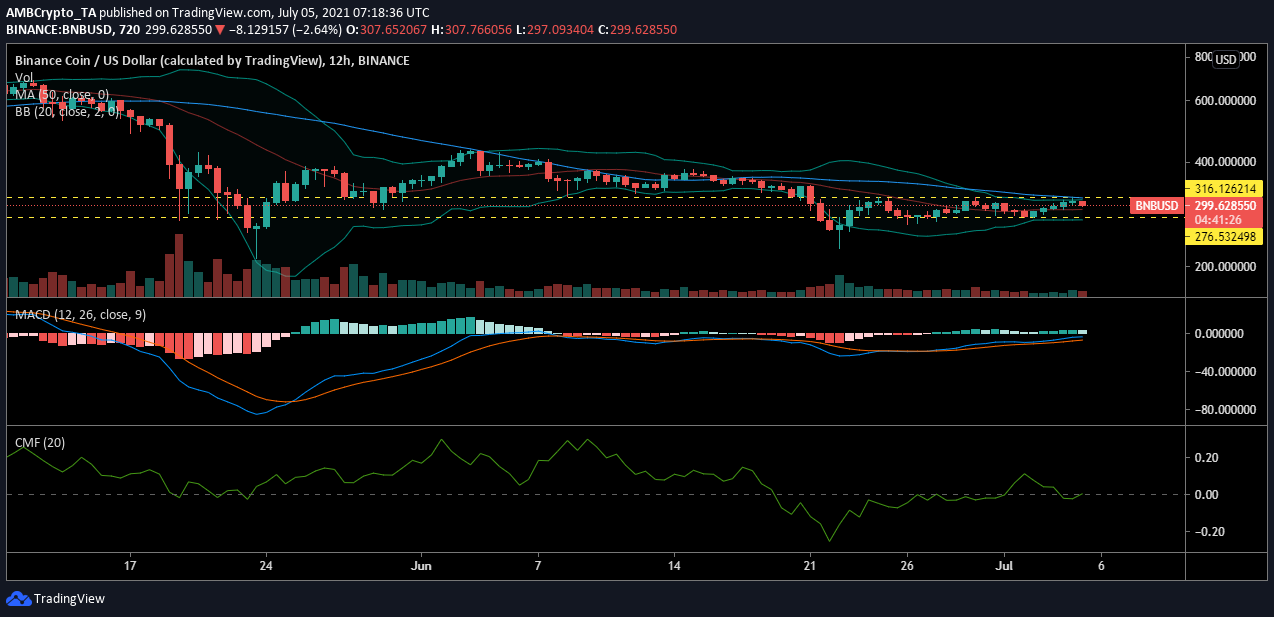
Binance Coin’s price maintained itself within the range of $276 and $316 ever since the crash on 22 June. Volatility reduced as BNB prices moved within the abovementioned range. Despite the reduced movement and multiple alarming regulatory news regarding Binance exchange, the asset held on strong to its current price level.
The MACD indicator was suggesting a level of bullishness in the market as the MACD line remained above the signal line. However, the histogram was noting a high level of bullishness. Meanwhile, money continued to enter the market as BNB was considered a more stable altcoin given the current market uproar.