While the phase after the fall is often that of recovery, many altcoin markets have been seeing another sell-off. The prices of Binance Coin [BNB], Bitcoin Cash [BCH], and Polkadot [DOT] have already been suffering due to the selling pressure visible in the market. However, as Bitcoin recovered, the alts were pointing at a potential trend reversal.
Binance coin [BNB]
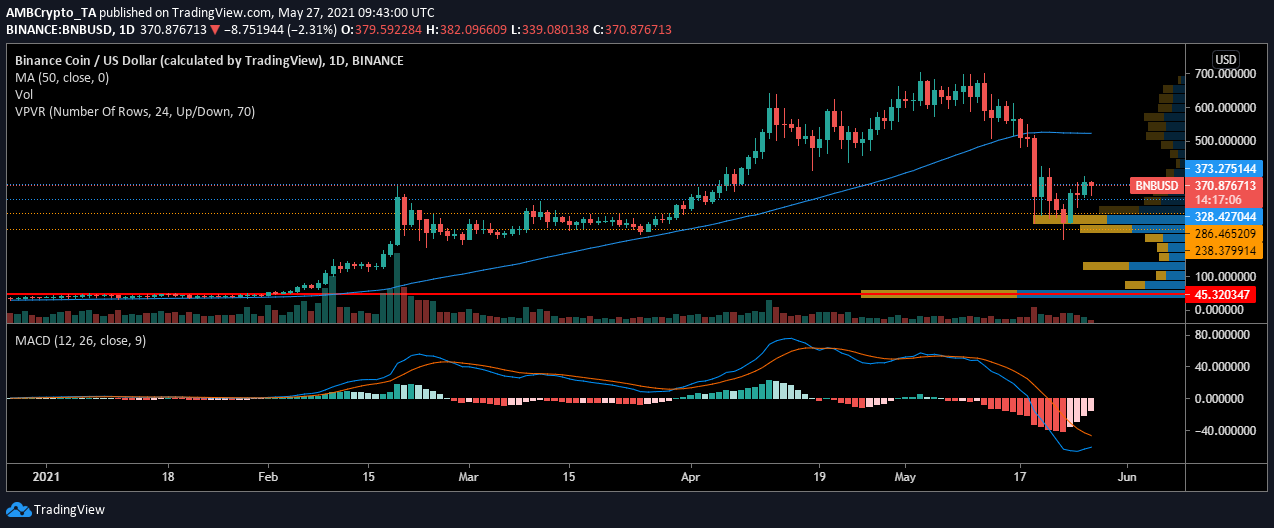
Source: BNBUSD on TradingView
Binance Coin [BNB] has generated great profits for its holders since the beginning of the year. This growth pushed its adoption in the cryptocurrency market and even though the overall market saw great volatility, BNB managed to hold on to at least 50% of its value from the peak.
At the time of press, BNB was traded at $373.90. It was trading above resistance level at $373.27. This upwards push did help the price, but the level was not seeing much interest from the traders. As suggested by the chart above, the volume was dropping, while Visible range indicated that not many traders were keen on trading at this level. The most-traded price level for BNB remained low at $45 in the given time period.
Bitcoin Cash [BCH]
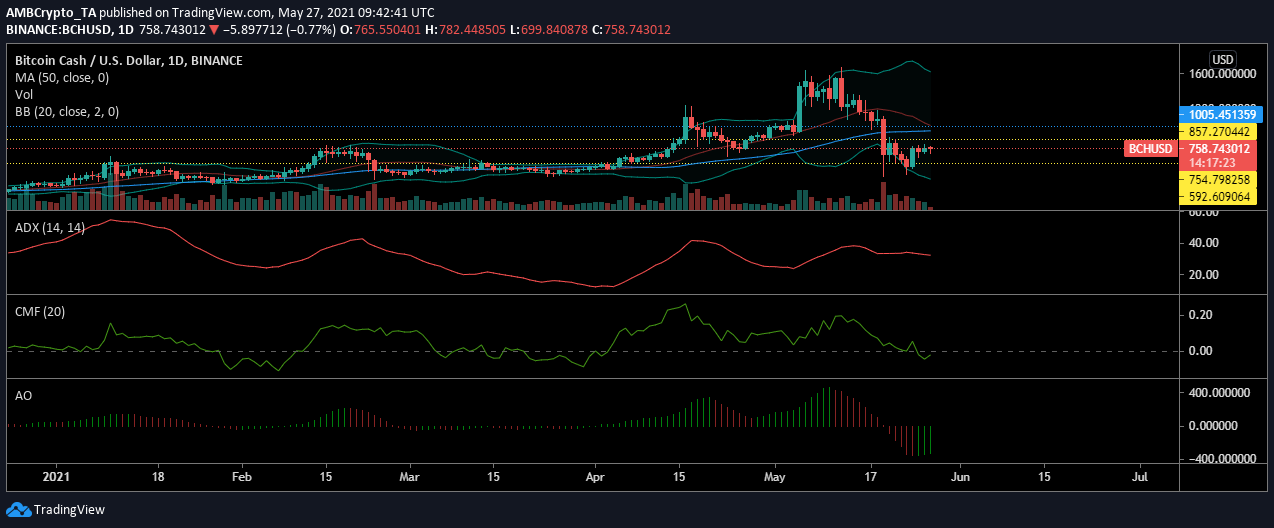
Source: BCHUSD on TradingView
The high volatility in the Bitcoin Cash market pushed the price lower and the growing gap between Bollinger Bands suggested that the price was going to see more action in the coming days. The signal line and the 50 moving average were about to crossover, which could add to the falling price.
At press time, BCH was trading at $760 between the range of $857 and $754. The digital asset has touched these extremes in a day and as it moves forward, the price may remain within this range. This trend was affirmed by ADX as the value of the indicator hit 32 suggesting the market was supporting the emerging trend. On one hand, the market was gaining momentum, but on the other money was still flowing out of the BCH market. This was indicative of the indecisive traders in the market.
Polkadot [DOT]
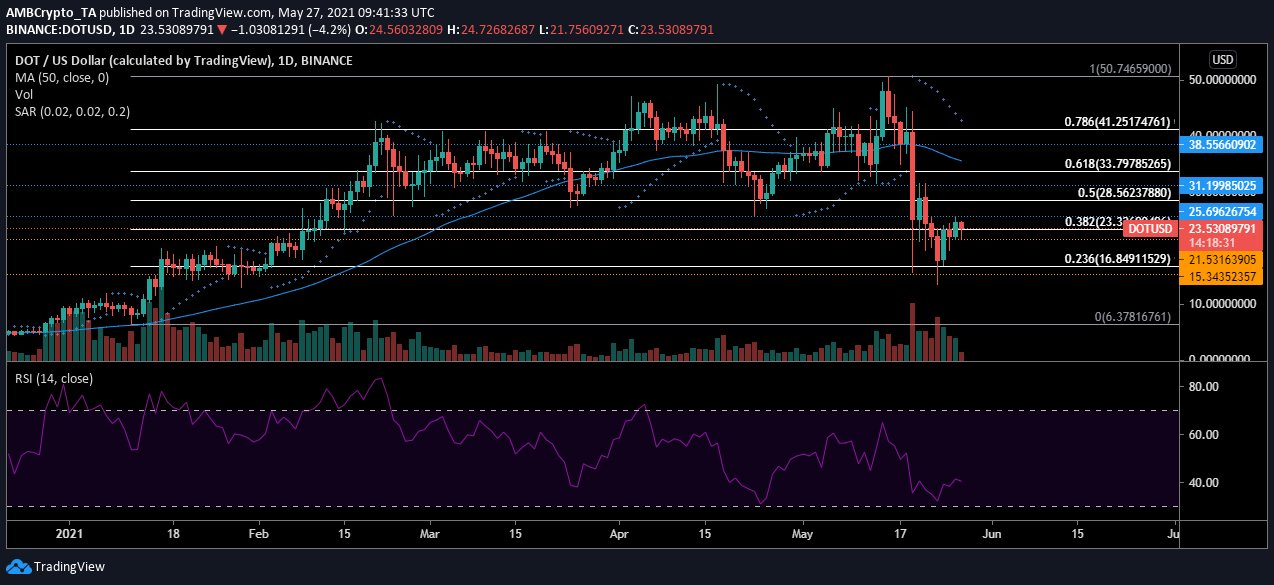
Source: DOTUSD on TradingView
Developments in the project have coincided with the rising price of DOT token. It was being traded at $24.02, while the markers from the Parabolic SAR indicator aligned above the price bars.
This was the sign of a heavy downtrend experienced by the DOT market. Unlike other alts, the current recovery was being supported by volume as indicated in the chart above. As the asset recovers from being oversold, Relative strength index was indicating the rise of buying pressure in the market. The low value and high returns of the DOT token have invited new buyers into the market, which could bring about trend reversal.