Chainlink, Solana, Matic Price Analysis: 27 May
Bitcoin was heading towards $40,000 for the second consecutive day of bullish trading. Although some altcoins were still faltering like Solana [SOL] and MATIC, others have recovered at a faster pace like Chainlink.
Chainlink [LINK]
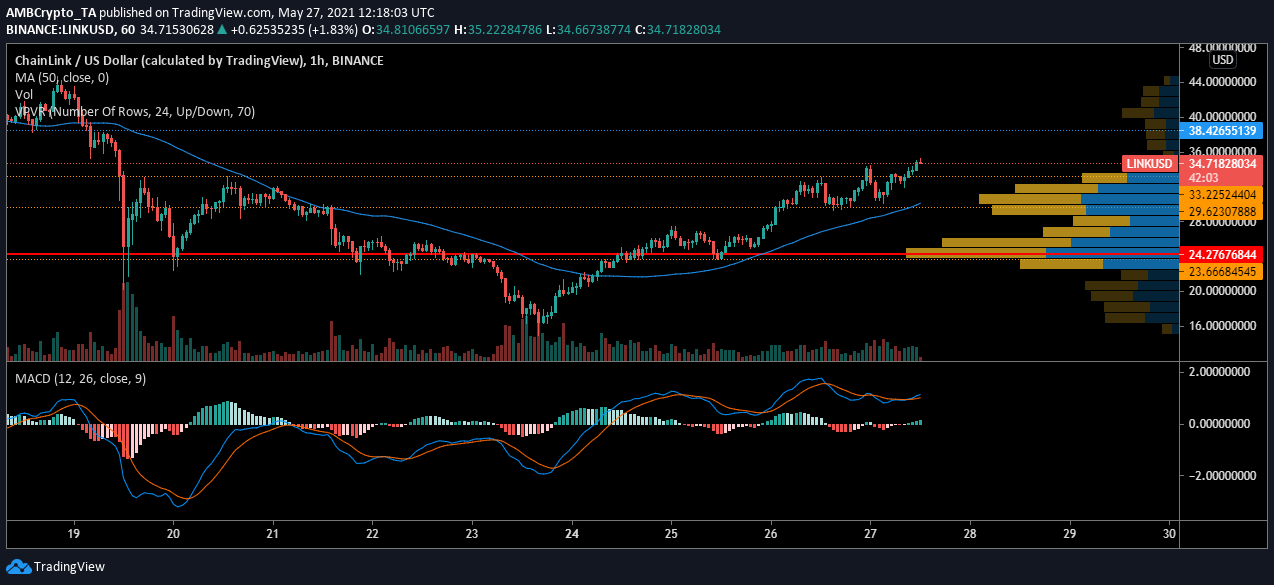
The above hourly chart of Chainlink [LINK] has been forming a giant V as the price dropped within a descending channel and was now witnessing a rise within an ascending channel. Although the digital asset has not made a complete recovery, LINK market has been extremely bullish. The price has jumped past resistances and was now at a value of $34.
As the price began recovering, the price crossed 50 Moving Average that provided a boost to the price. After periods of consolidation followed by surging prices, LINK traders created several tradable levels. If the price of LINK turns around, it may find support at $31, which was a range supported by traders. The Visible range indicator suggested $24.27 as the most traded range for LINK in the current period. LINK may continue to consolidate at $33 as long as the buying pressure sustains.
Solana [SOL]
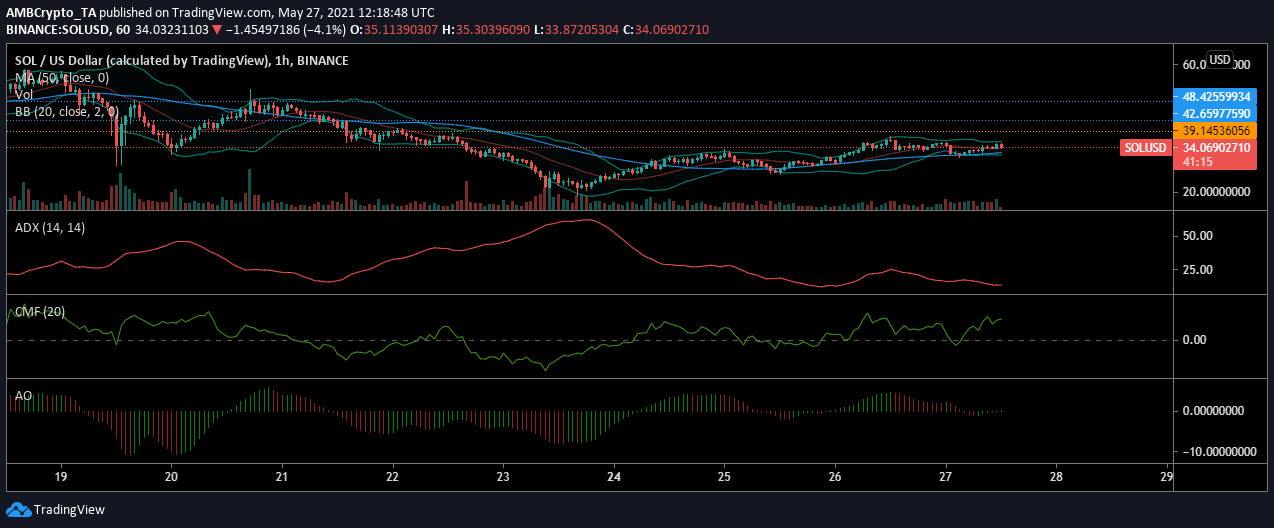
The traders have held the value of SOL at around $32. Even as it traded at $34, the base center point has remained $32 after over 50% recovery.
To support the price swing in any direction, the ADX will have to move above 25 and it was currently at 13. The market was also boasting low momentum which could be a sign of the continued consolidation of SOL.
Polygon [MATIC]
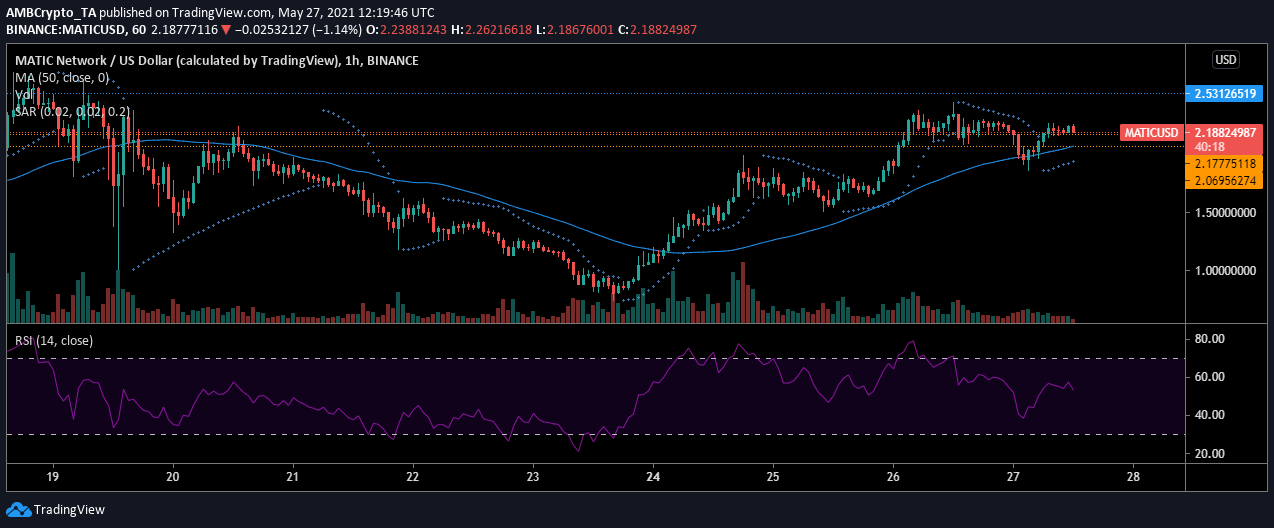
MATIC market has been growing steadily and has almost recovered from its fall. Although it has not hit its peak, MATIC was trading at higher price levels. However, in the short term, the asset has been dealing with rising selling pressure.
MATIC was witnessing an evolving sell-off that pushed it under $2.17 and was headed to $2.06. As the 50 Moving average approaches the candle, a crossover could lead to more bearish implications. This sell-off can be indicated by Relative Strength Index which was currently falling lower from the equilibrium zone suggesting a rise in selling pressure.
As MATIC stumbles in the market, it may find support at $2.06 and the price could turn around from this point.


