Binance Coin broke down beneath a triangle pattern in a hunt for buyers


The price is always attracted to liquidity. That had been a reason why Binance Coin repeatedly tested the $510 support level over the past two months and it exhausted the buyers at those levels. At the time of writing, the price was in search of an area where buyers would be similarly interested once more. The $445 level leaped to the eye as support. However, the pertinent question here is- Could Binance Coin embark on one further leg southward to $400?
BNB- 1D
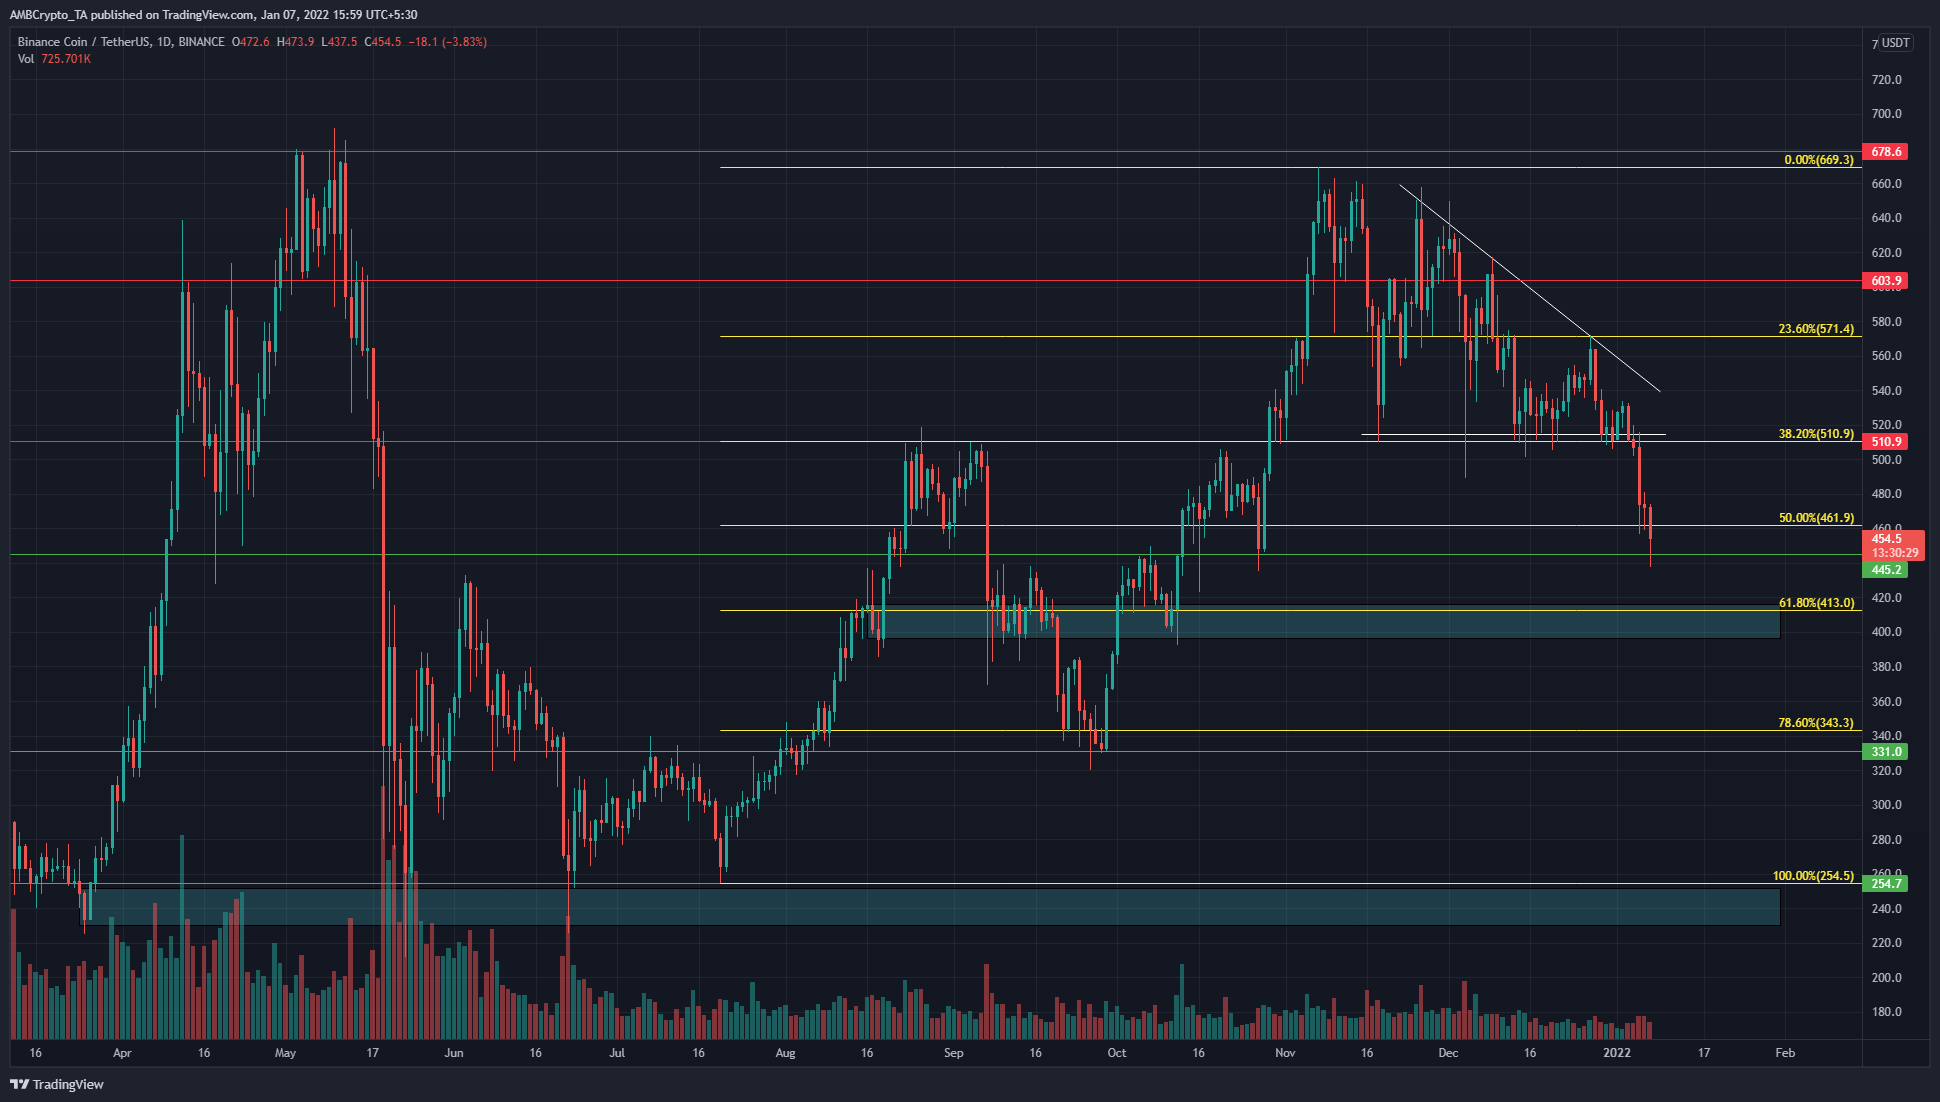
Binance Coin formed a descending triangle pattern (white) as it repeatedly tested the $445 area as support, but the price broke down beneath it.
The $445 level served as strong support in October, where the sellers were absorbed. In fact, the price had a strong impulsive reaction and bounced off the level. It went on to climb as high as $670 in the days that followed.
Once more, the $445 area was likely to have a heavy batch of buyers, and the price could react positively. Thus, it could move upward once again.
The move from $254.5 lows in August (another demand area) to the $669 highs were used to plot Fibonacci retracement levels, and the price was also below the 50% retracement at $461.9.
Generally, buyers are interested in an asset at the 61.8-78.6% retracement levels, and for BNB, that represented the $343-$413 area.
Rationale
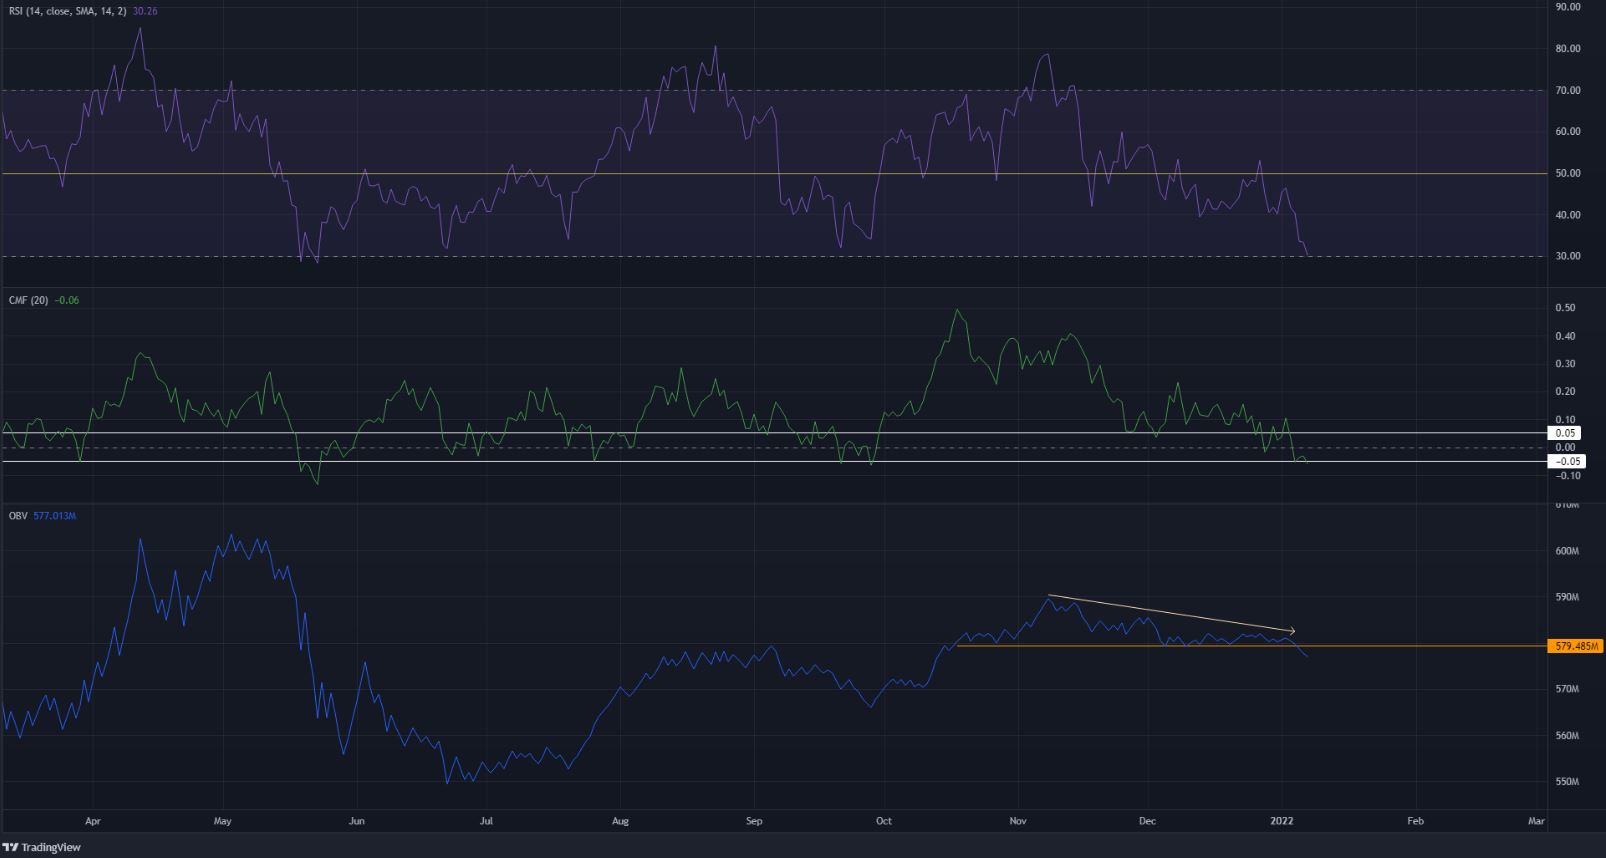
The daily RSI was at the 28-30 mark once more, a level it had last been at in May when the price crashed from $670 highs to $254 low. This suggested that the price was close to finding a bottom, although an exact bottom can not be determined based on RSI alone. The RSI fell below the 28 value during March 2020 on the Covid crash.
The OBV also slipped beneath a level (orange) that had held firm since October. In fact, the CMF also slipped beneath -0.05 to show that capital flow was headed out of the market, but as the OBV indicated, this had already been the case for a few weeks now.
Conclusion
The indicators showed strong selling pressure. The price charts showed $413 and $445 as strong support levels. Well, $400 could be a place where a candle could wick to or even close at. A trading day close below $461 (50% level) would likely mean BNB was headed to the next level of retracement at $413.