Binance Coin, Chainlink, Theta Price Analysis: 4 July

Bitcoin’s 4.88% rise over the past day reflected in the positive price movements of altcoins too, many of which headed for recovery after incurring losses in late June. Several altcoins remained within a restricted price range since then, while market volatility remained low. Binance Coin registered significant gains in the past week, while Chainlink experienced a rise in capital inflows. Both of these coins, along with THETA, noted an upward trend as the market remained in a bullish spell.
Binance Coin [BNB] –

Source: BNB/USD, TradingView
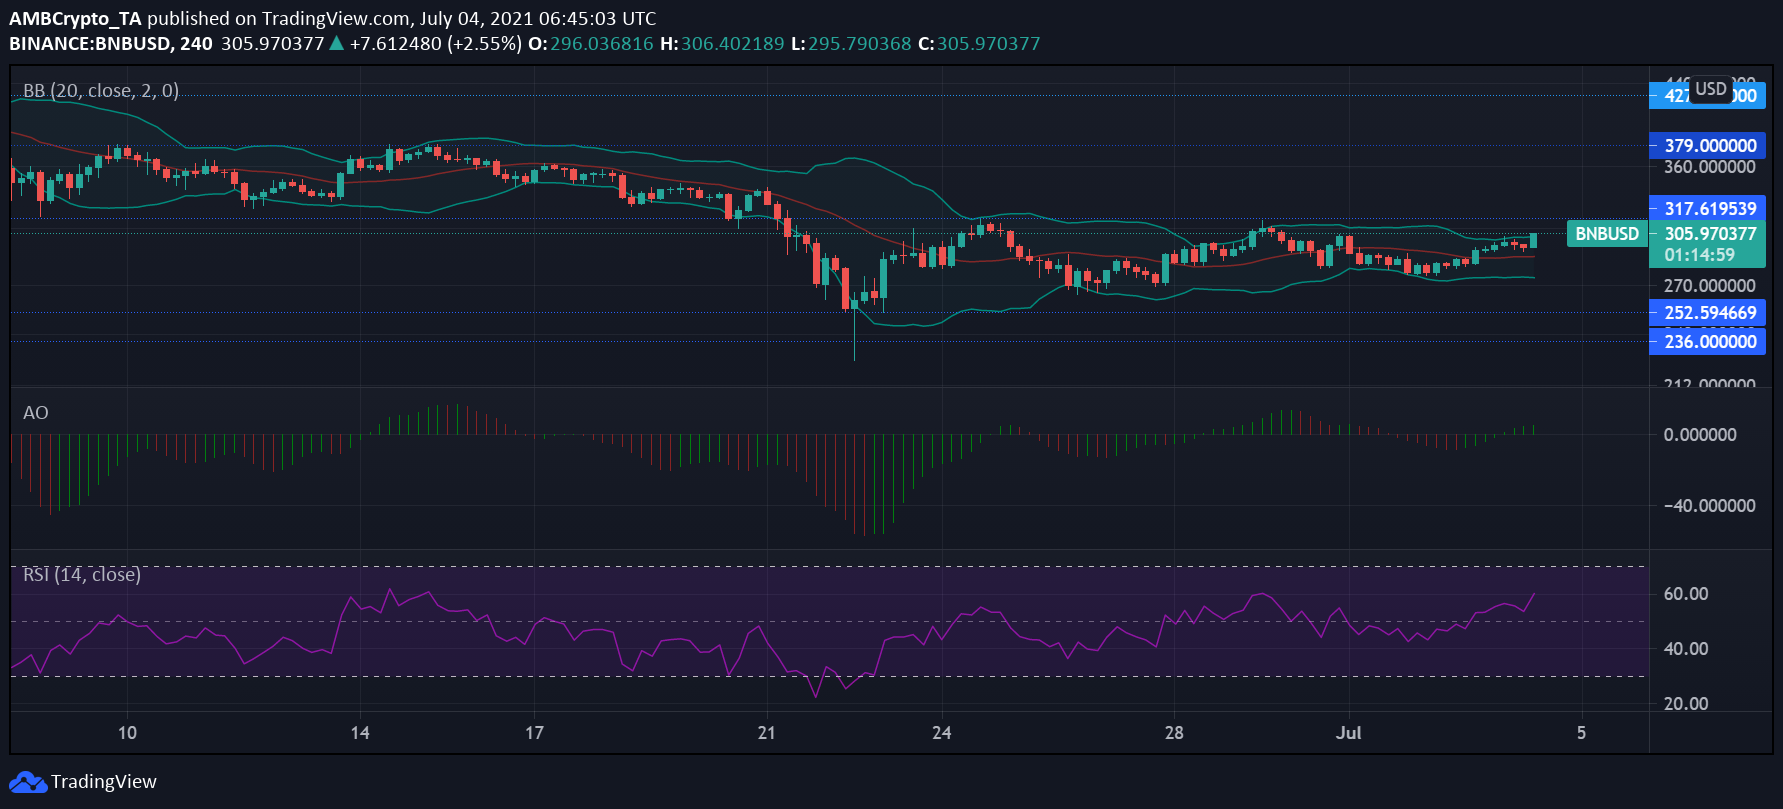
Earlier this week, the crypto exchange Binance was charged with criminal complaints by the Thai SEC, and an investigation was opened against it by the Cayman Islands monetary authority. This did not seem to have deterred Binance Coin’s gains, as they totaled 6.3% over the past day, while its one-week price hike was 9.4%.
Since a price fall on 21 June where it breached the $317 support, BNB had been oscillating between $317 resistance and $252 support levels. The coin, trading in the green, was valued at $305 at press time.
The asset’s price chart pictured a build-up of bullish momentum, as green bars showed up at top on Awesome Oscillator. Relative Strength Index (RSI), which had been near the median line for almost a week, crossed over into bullish territory yesterday with a sudden rise in buying pressure. It was on the rise at press time, last noted at 60.19.
Bollinger Bands moved parallelly, suggesting that market movement would be stable going forward and moderate volatility could be expected.
Chainlink [LINK] –

Source: LINK/USD, TradingView
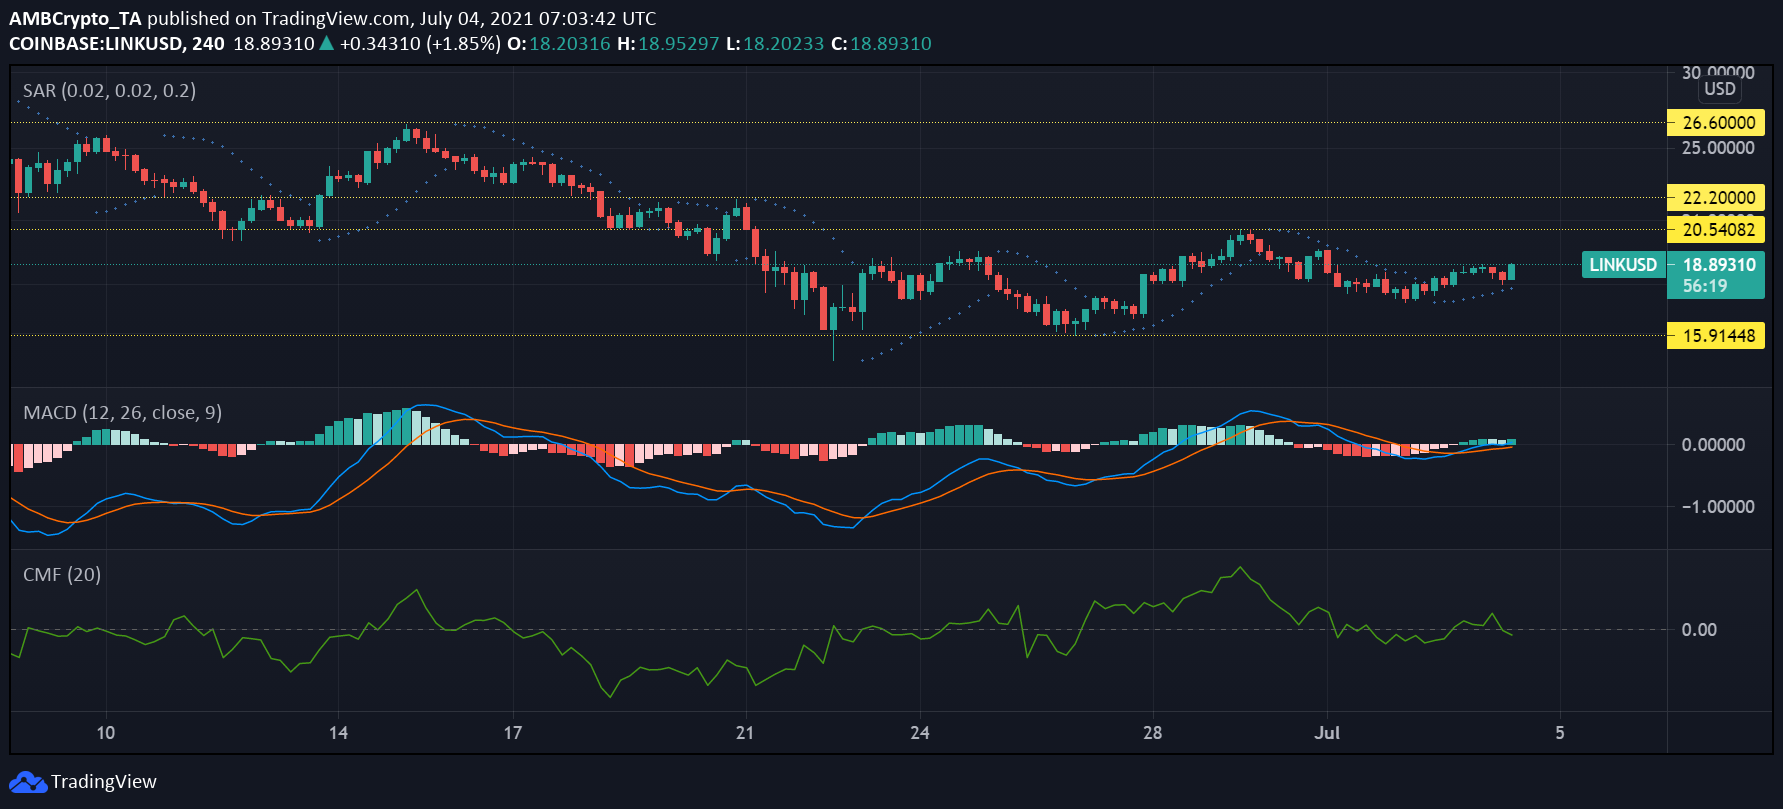
Chainlink’s daily trading volume was down by 3.80%, even as its price rose by 3.3% over the past day. The coin’s price movement had been constricted between $20.5 and $15.9 over the past few weeks, and it was trading at $18.8 at the time of writing. The alt was down 64.5% since hitting an ATH in May .
A bullish crossover took place on MACD, as the indicator line moved above the signal line. The indicator’s histogram suggested that a bullish trend was picking up. Parabolic SAR’s dotted line hovered below the candlesticks since 2 June, as LINK’s price action followed a bullish trend.
However, capital outflows seemed to have taken precedence over inflows, as Chaikin Money Flow moved below the equilibrium and stayed in the neutral bearish territory at the time of writing.
Theta [THETA] –

Source: THETA/USD, TradingView
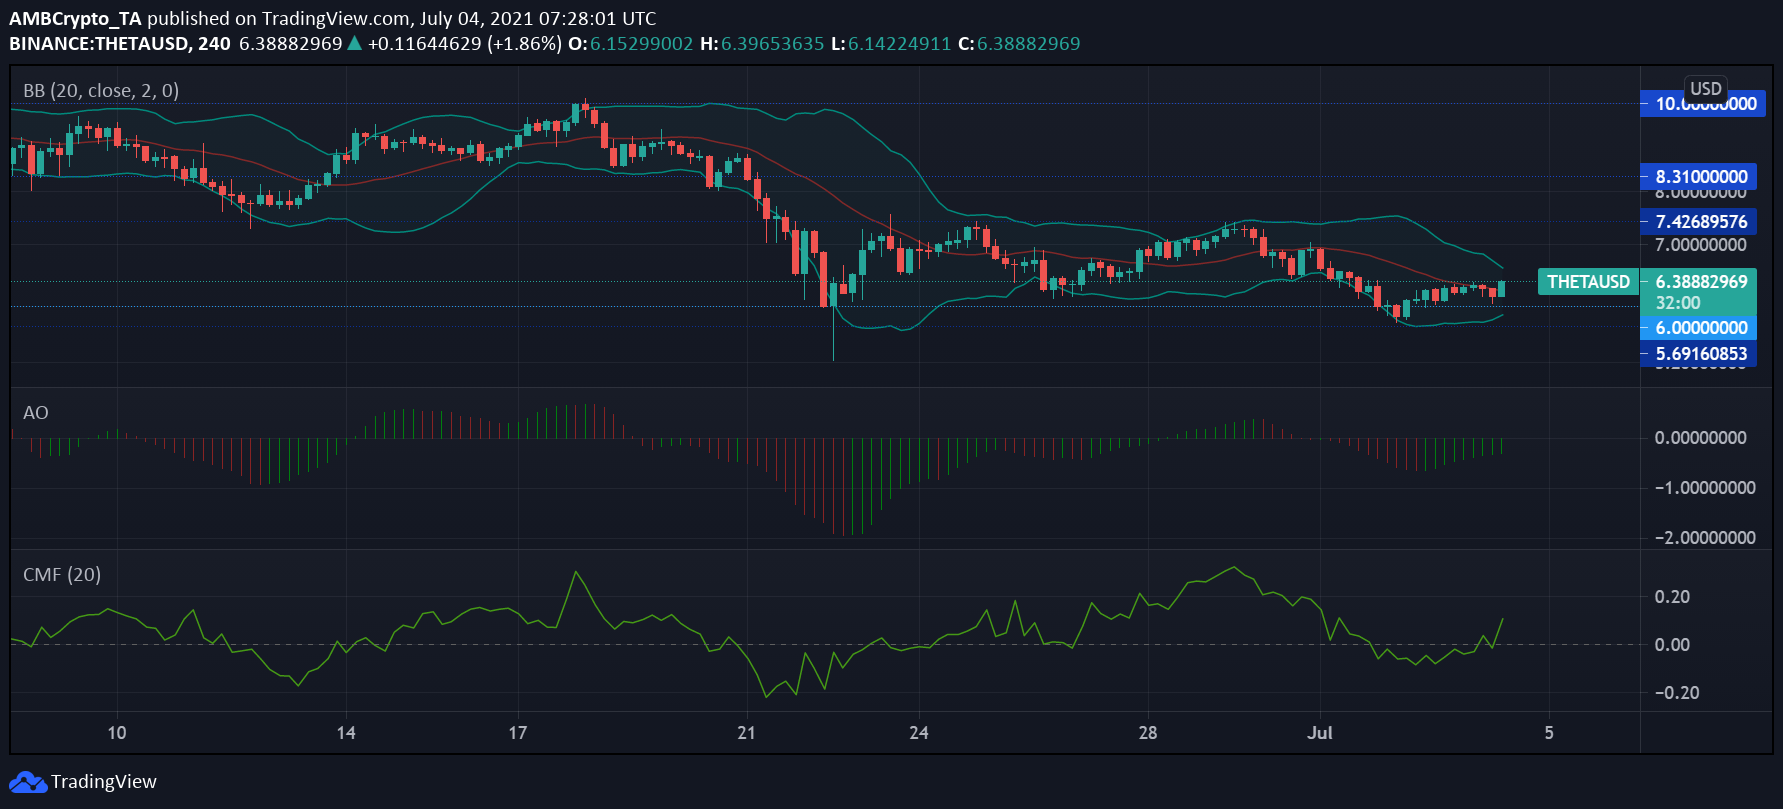
THETA’s market cap, at $6.3 million, rose up by 3.12% over the past day, even as its trading volume fell by 64.5% during the same time period. It was valued at $6.35 at the time of writing and ranked 20th on CoinMarketCap. While it momentarily breached the support at $6 on 2 July, the coin bounced back up and had since then been trading near the $6.35 mark.
Bollinger Bands for the asset had begun to contract, as market volatility died down. Its 30-day volatility was at 1.26. Price movement may possibly be restricted going forward. The build-up of bullish momentum on the coin’s charts could be noticed, as the green bars formed on the lower side of Awesome Oscillator’s histogram.
Chaikin Money Flow passed over the zero-line into bullish territory as capital inflows dominated the outflows. If buyers remain persistant, the price has a chance of moving higher up.

![Story [IP] on the verge a triangle breakout — Will IP hit $9 or $3?](https://ambcrypto.com/wp-content/uploads/2025/03/Lennox-1-400x240.jpg)


