Binance Coin, Cosmos, Dash Price Analysis: 19 January

Binance Coin and Cosmos touched record levels after a surge in market leaders BTC and ETH‘s charts lifted the broader cryptocurrency market. Further down the crypto-ladder, DASH registered a breakout and was heading towards the $136.38-resistance level.
Binance Coin [BNB]

Source: BNB/USD, TradingView
Binance Coin cooled off from its all-time high and traded close to the $44.75-support level. At the time of writing, BNB slipped into the red territory at the price traded at $45.6, down by 0.14% in the last 24 hours. If the price holds steady at its press time support, a bullish scenario could see BNB hit newer highs before cooling down.
The Stochastic RSI stabilized around the neutral zone after moving lower from the overbought zone. If the index revisits the upper zone, the price could scale to fresher record levels.
On the other hand, the MACD showed that the bullish momentum was slowing down and a bearish crossover could see BNB fall towards the $41.7-support level.
Cosmos [ATOM]

Source: ATOM/USD, TradingView
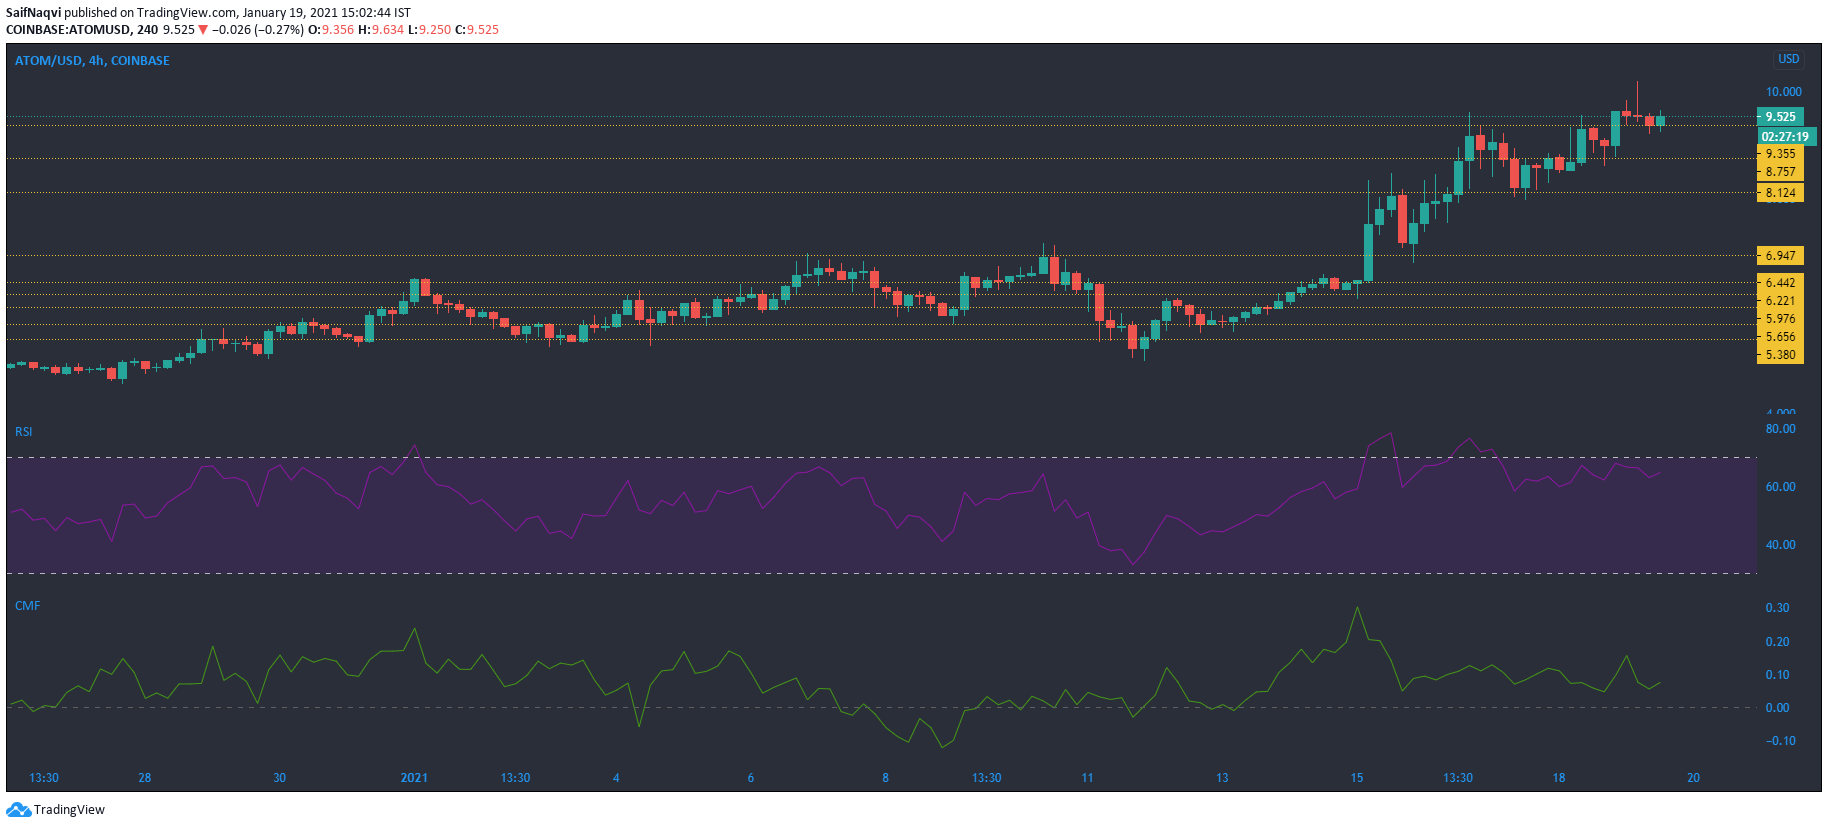
ATOM stabilized just below the $10-mark after the price touched yet another all-time high at $10.1. An extended bull run would likely see the price topple its previous all-time high. The indicators had not peaked and underlined more bullishness unless a broader market pullback was to strain the price.
The Relative Strength Index eyed the overbought zone once again and indicated that the price could move north.
Finally, the Chaikin Money Flow showed that capital was moving into the cryptocurrency market.
Dash [DASH]

Source: DASH/USD, TradingView
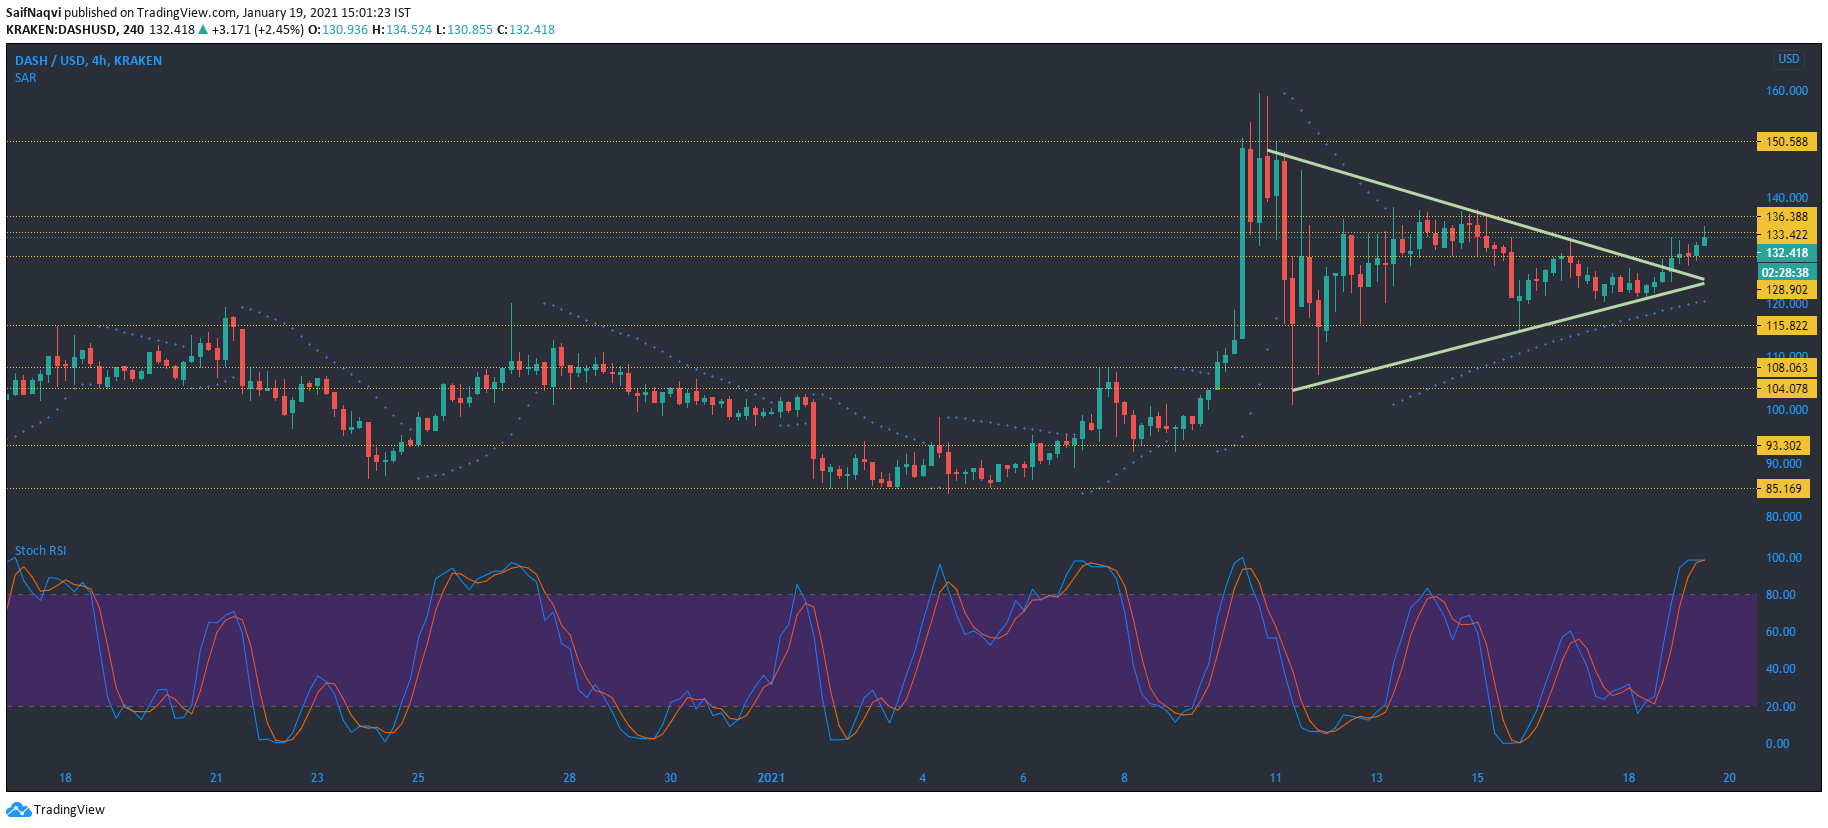
DASH witnessed a breakout towards the $133.4-resistance level after the price formed a symmetrical triangle on the 4-hr chart. If the price does continue its upward ascension, the $150-mark would come into focus.
The Parabolic SAR’s dotted markers were below the candlesticks and showed that the price had been on an uptrend over the past week.
The Stochastic RSI suggested that the price could reverse trajectory as the index traded in the overbought zone, an area from where the index typically moves lower. However, the indicator could hold up in the upper region for a few more sessions before moving lower.


