Binance Coin, Cosmos, Dogecoin Price Analysis: 08 February

Binance Coin reversed its dip and looked set on retesting $75.5 once more. Cosmos showed the beginning of a bearish divergence as it climbed toward its target of $15.84, and Dogecoin showed a buy signal as it rose toward $0.08 once more.
Binance Coin [BNB]

Source: BNB/USDT on TradingView
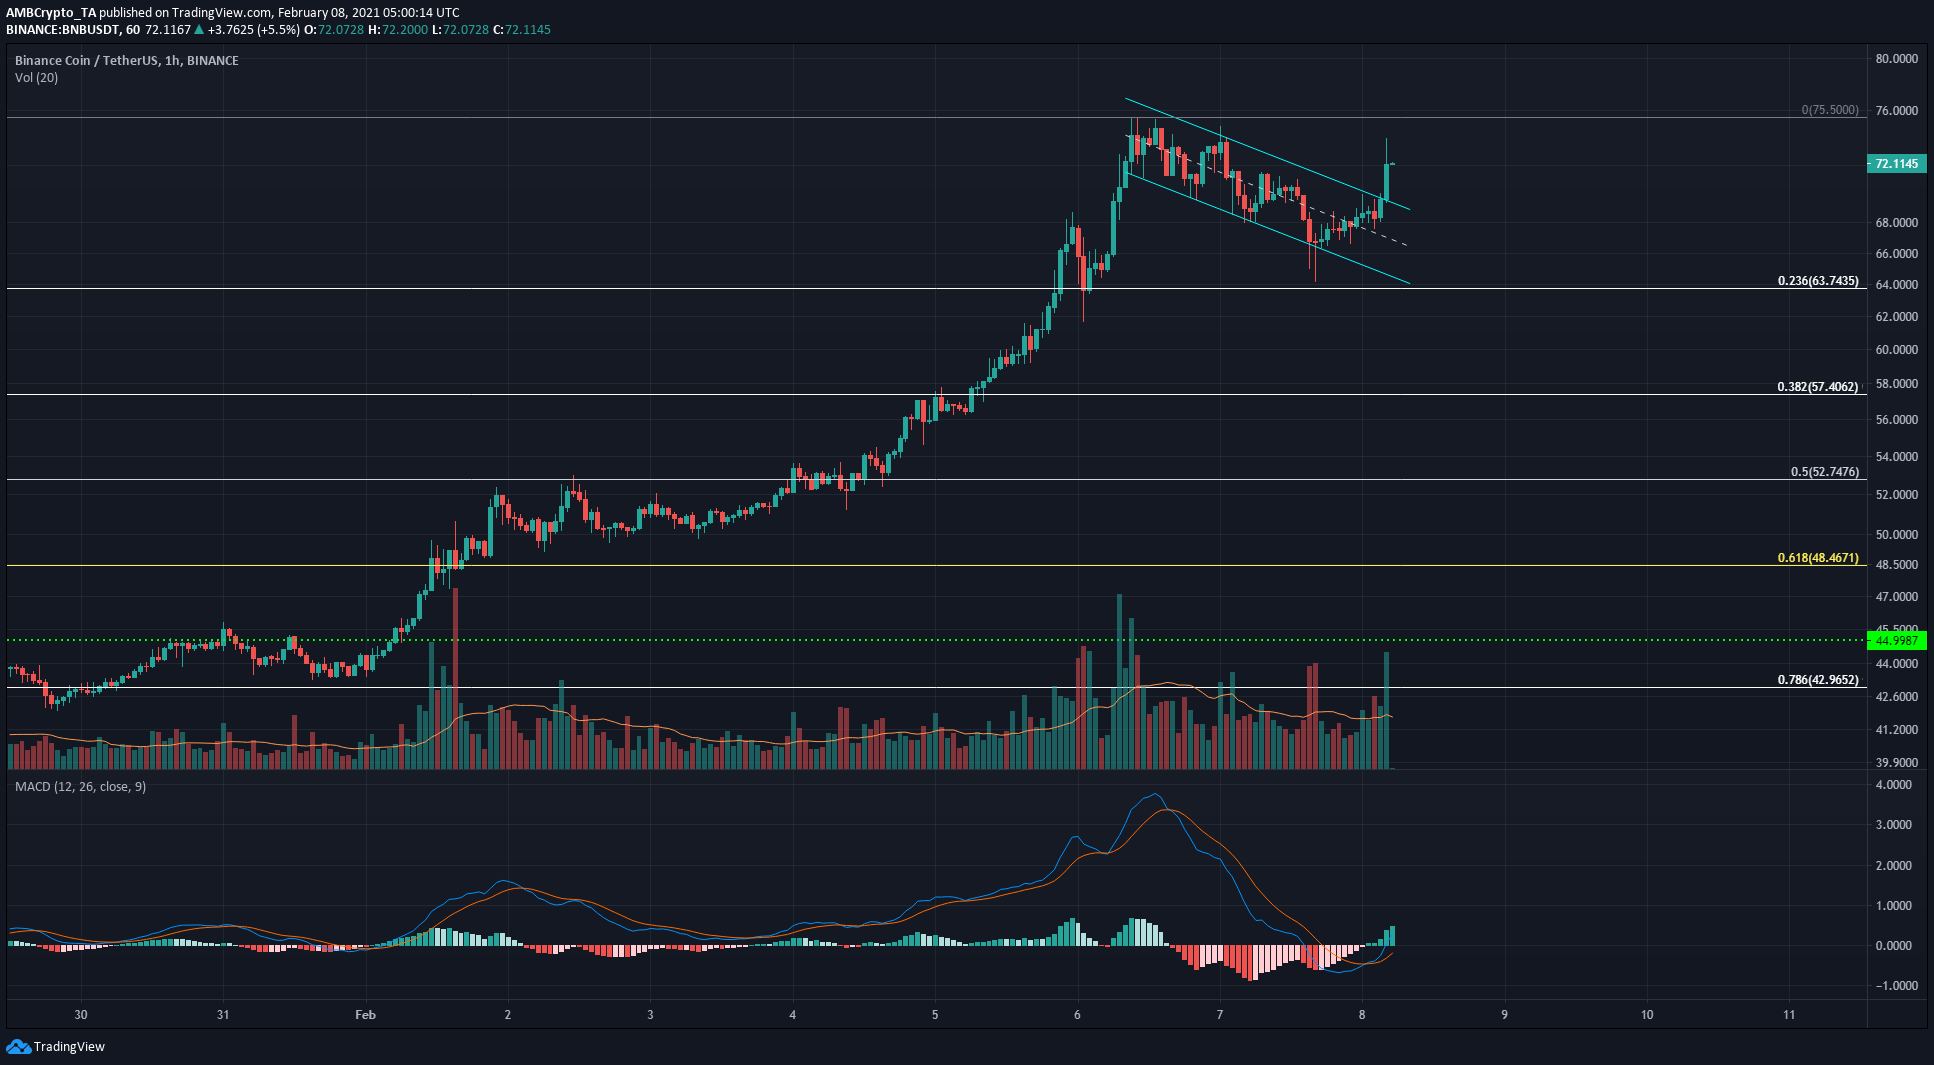
On the 1-hour chart, BNB formed a descending channel and broke back above the channel. This pattern is a bullish reversal pattern and sets a technical target of $75.5 for BNB. The short-term momentum has swerved back in favor of the bulls, as shown by the MACD.
BNB showed some strength in recent hours when it dipped to $66.5, but the buyers stepped in and pushed the price back above $67.8. This level has acted as resistance only two days ago, and its flip to support is a bullish sign in the short-term.
A move beneath $68 would signal imminent bearish pressure.
Cosmos [ATOM]

Source: ATOM/USD on TradingView
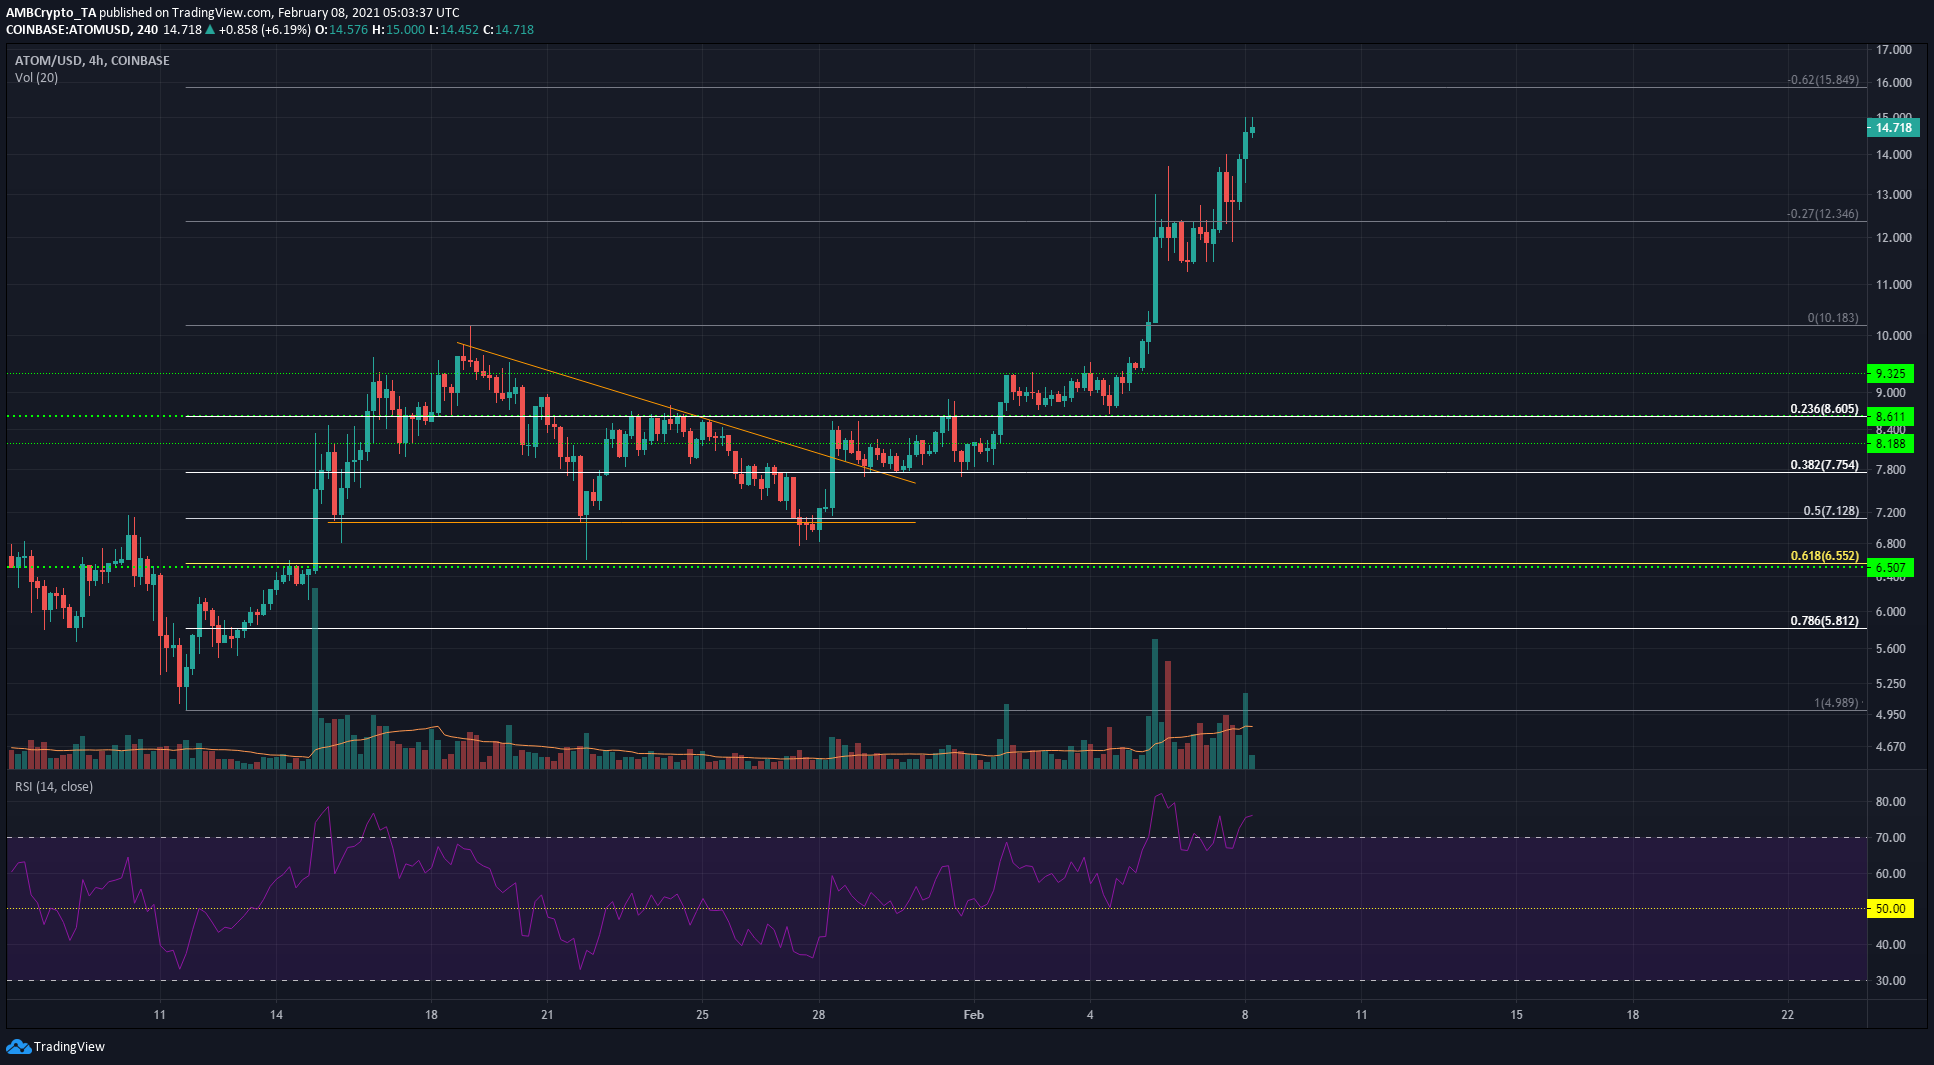
Although ATOM did show an overbought bearish divergence, it did not imply an immediate pullback. The 62% extension level presents a target of $15.84 for ATOM, and a candlewick up to this level could be seen before a pullback.
Entering a short trade around this mark for a scalp could result in profits. A Doji candle on strong volume would be a strong indication of a shift in market sentiment and can be used to short ATOM.
Longer-term traders would need to wait for a pullback to $12.35 to find good buying opportunities.
Dogecoin [DOGE]

Source: DOGE/USDT on TradingView
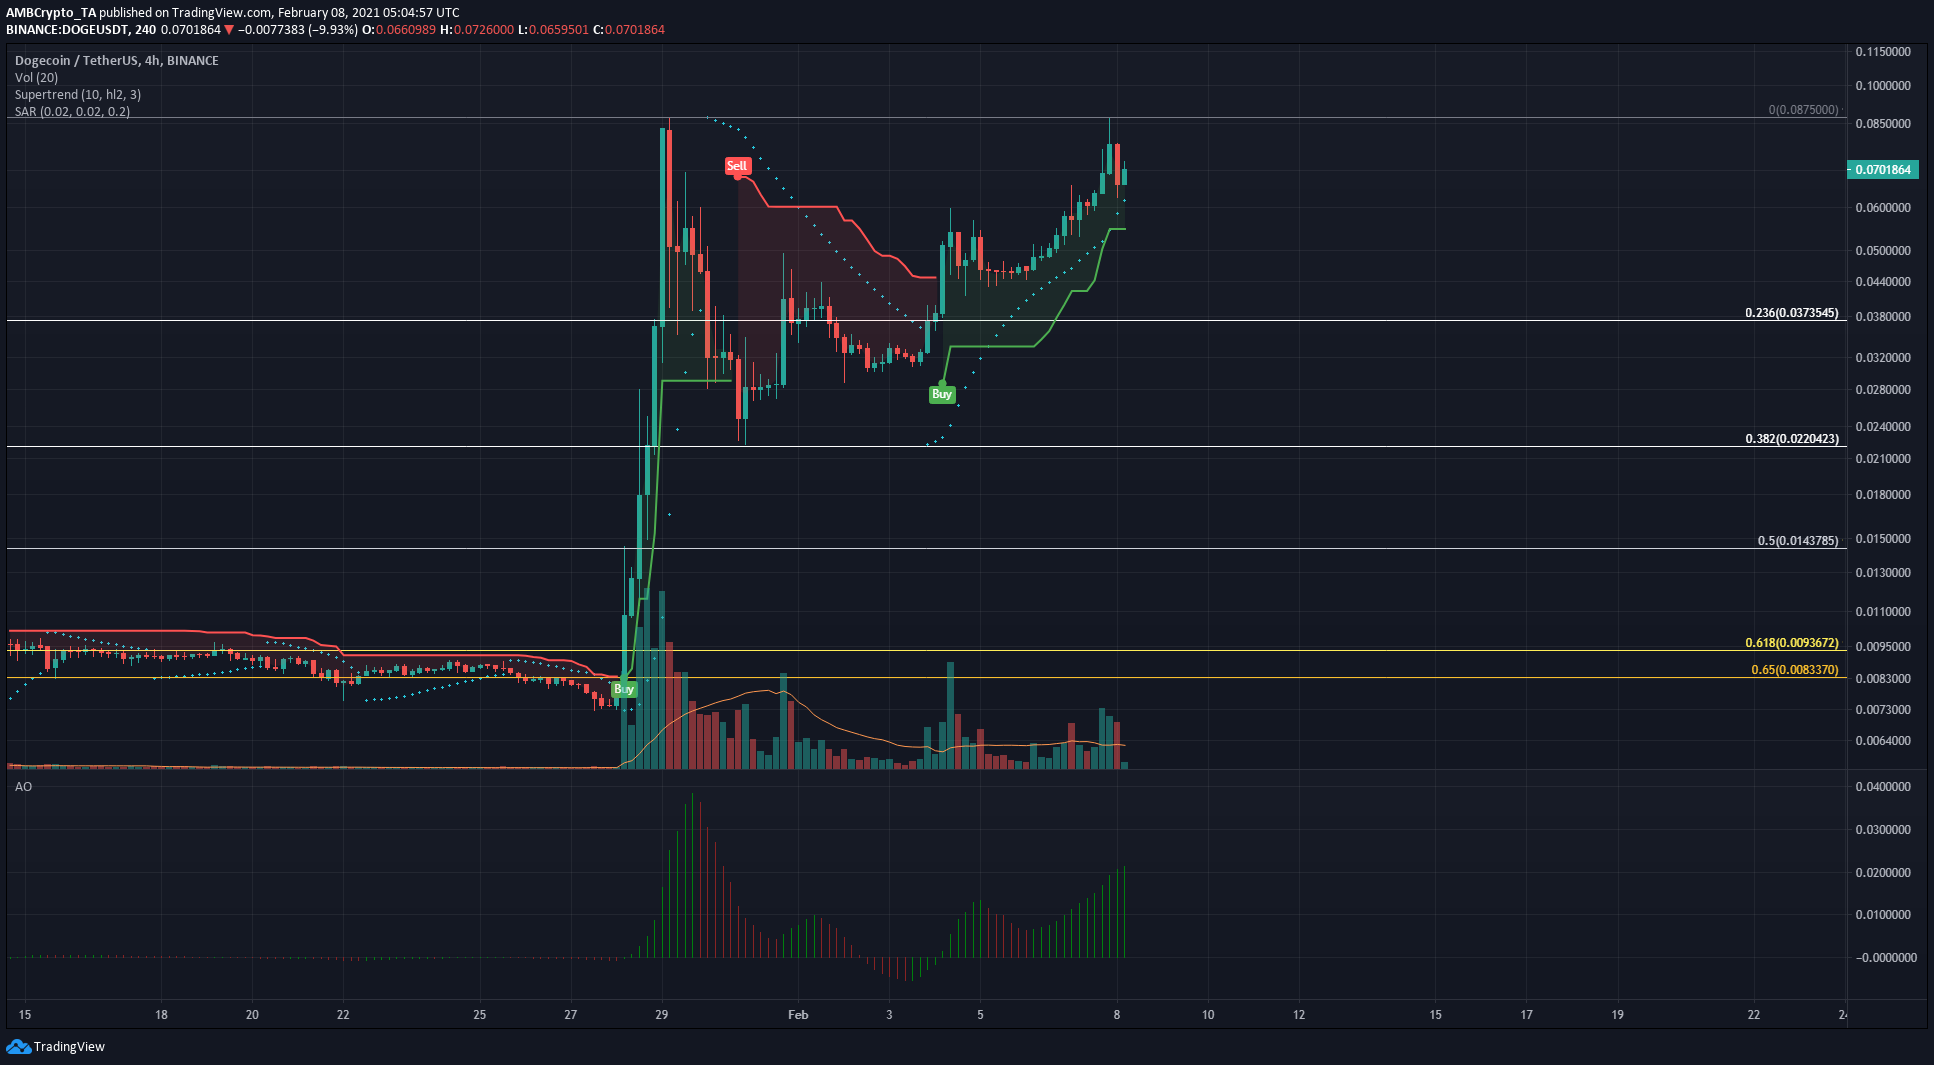
DOGE climbed above the 23.6% retracement level at $0.0373 level and surged back toward $0.08 over the past week. Both the Parabolic SAR and the Supertrend gave a buy signal. Either indicator can also be used to set a stop-loss after entering a position.
The Parabolic SAR gives, at the time of writing, $0.061 as SL on the 4-hour chart, while Supertrend points at a more liberal $0.055 mark.
Mis-timing the DOGE market would be a costly mistake, and risk management and profit-taking must be a priority when trading DOGE. The Awesome Oscillator showed strong bullish momentum, and this could take DOGE past the local high at $0.0875.


