Connect with us
Active Currencies 18086
Market Cap $4,188,888,758,549.10
Bitcoin Share 57.24%
24h Market Cap Change $4.16

Binance Coin, Fantom, Waves Price Analysis: 16 March

2min Read
Binance Coin, Fantom, Waves Price Analysis: 16 March
Share this article

The past 24 hours saw a spike in prices for Binance Coin as Bitcoin saw a small surge- but the upside move was quick to recede. Bitcoin had jumped from $38.2k to touch $41.6k and had fallen to trade at $39.3k at the time of writing. Fantom also pushed higher, but not enough to break the bearish market structure.

Binance Coin (BNB)

Binance Coin, Fantom, Waves Price Analysis: 16 March

Source: BNB/USDT on TradingView

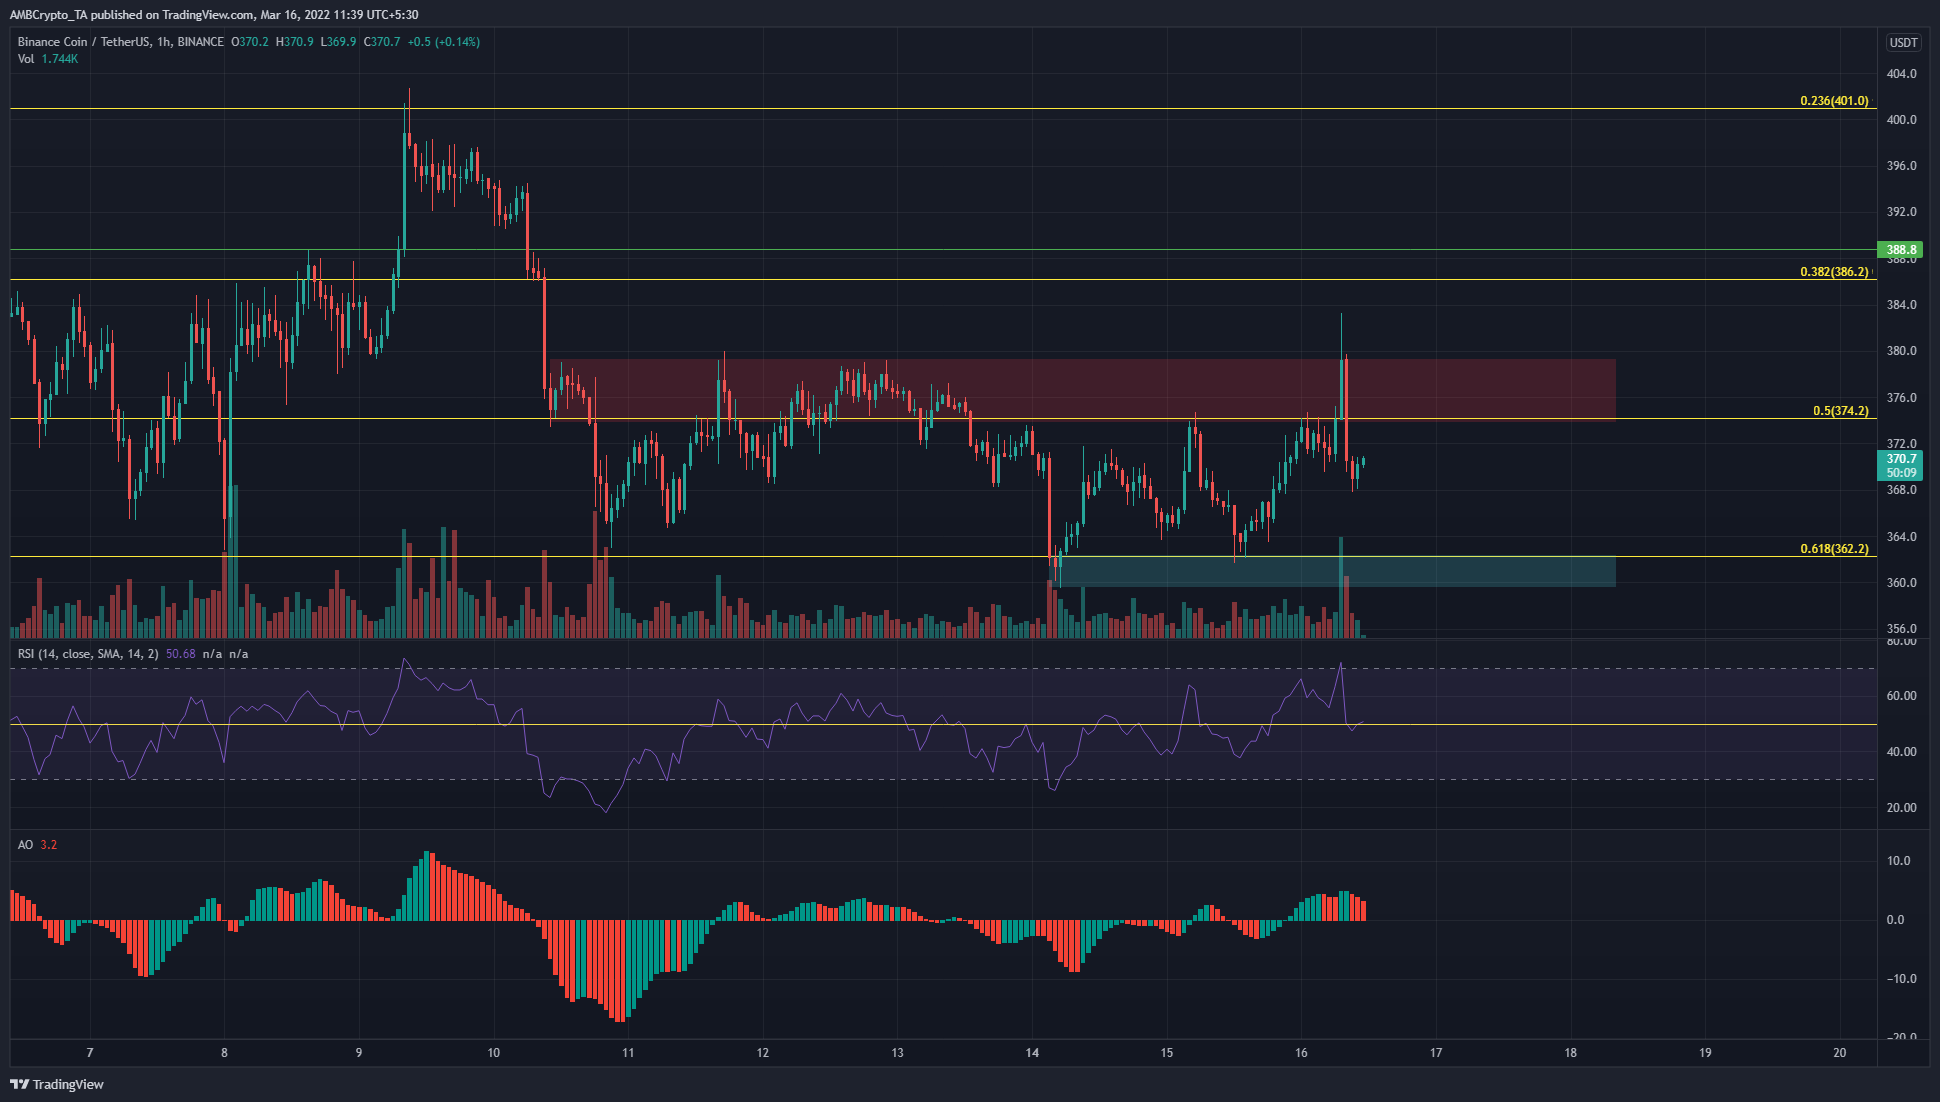
In the past week, the $374-$380 area has acted as a supply region. A strong hourly session saw BNB rise to $382, but this has been sold off aggressively in the hours since. In the comings hours, a revisit of this area could be sold once more.

The longer-term trend has been downward, and the $362 level has been tested multiple times as support- but could break in the days or weeks to come. On the hourly chart, the RSI and the Awesome Oscillator hovered near neutral territory following the volatility of the recent hours.

Fantom (FTM)

Binance Coin, Fantom, Waves Price Analysis: 16 March

Source: FTM/USDT on TradingView

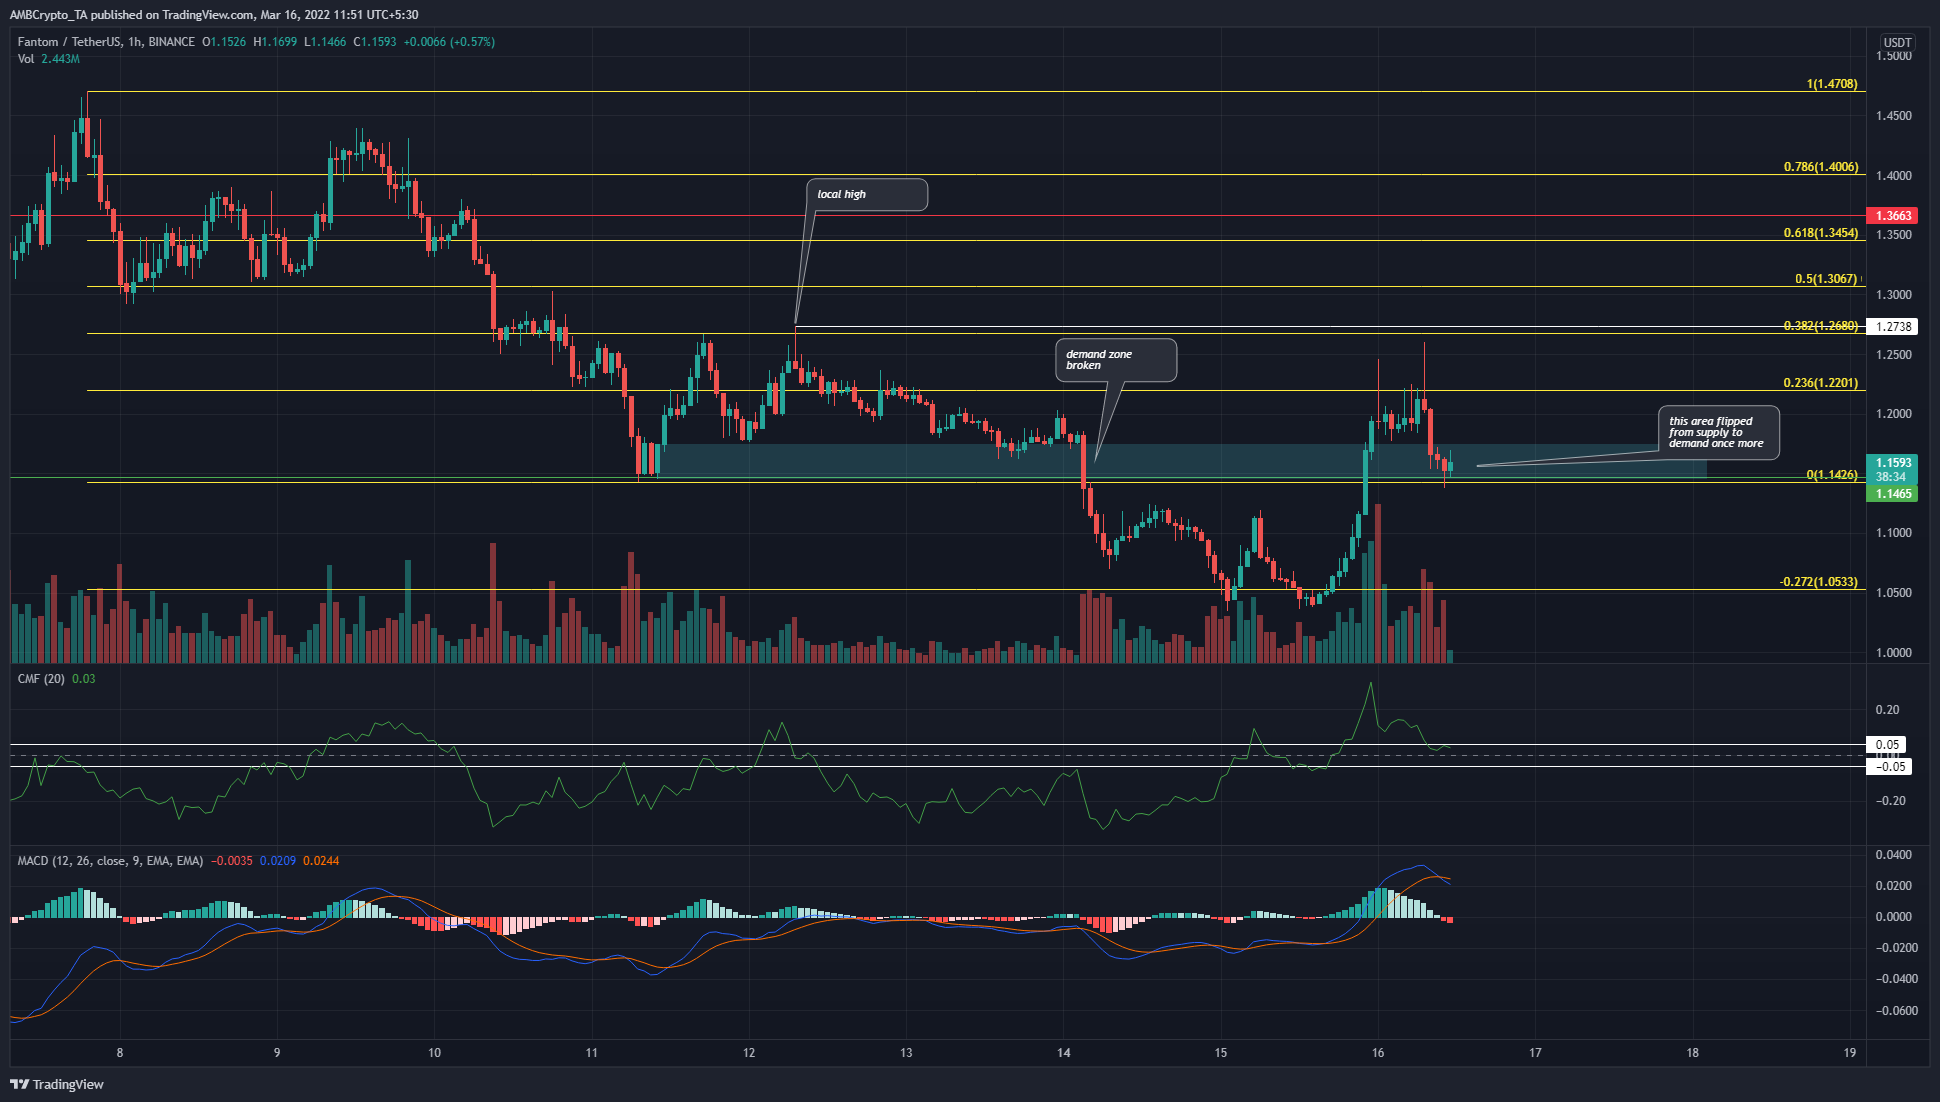
The $1.16 area was a demand area in the past week but was decisively broken a couple of days ago. The short-term Bitcoin surge saw FTM rise back above the $1.16 area, and retest the $1.14 level as support.

This area made for a good risk-to-reward region to long FTM at for a scalp long trade, with $1.22-$1.24 as a take-profit region. The longer-term trend pointed to more downside, hence a rally might not be on the cards. The CMF was at +0.03, and the MACD formed a bearish crossover above the zero line.

Waves (WAVES)

Binance Coin, Fantom, Waves Price Analysis: 16 March

Source: WAVES/USDT on TradingView

Based on WAVES’ move from $16.73 to $31, a set of Fibonacci retracement levels were plotted (yellow). The past few hours have seen a strong rise in demand, as evidenced by the spike in the OBV. This showed that a run higher could be seen in the coming days. To the upside, $34 and $37 are targets to take profit at.

The RSI on the hourly was in overbought territory, which by itself does not mean a pullback was imminent.

Share
Akashnath S is a Senior Journalist and Technical Analysis expert at AMBCrypto. He specializes in dissecting price action, identifying key market trends through advanced chart patterns, and forecasting both short-term and long-term asset trajectories. His distinct analytical method is grounded in his academic training as a Chemical Engineer. This background provides him with a systematic, process-oriented approach to market data, enabling him to analyze the complex dynamics of financial markets with precision and objectivity. Having actively covered the cryptocurrency space since the landmark 2017 market cycle, Akashnath possesses years of experience navigating both bull and bear markets. This seasoned perspective is critical to his insightful reporting on market volatility and evolution. As an active market participant, Akashnath enhances his analysis with crucial, hands-on experience. This practical application of his technical skills ensures his insights are not merely theoretical, but are also relevant and actionable for an audience looking to understand and navigate trading opportunities. He is dedicated to educating readers on the nuances of technical analysis, empowering them with the knowledge to make more informed financial decisions.
Read the best crypto stories of the day in less than 5 minutes
Subscribe to get it daily in your inbox.
Please check the format of your first name and/or email address.
Thank you for subscribing to Unhashed.