Binance Coin forms a continuation pattern as $510 beckons

Binance Coin was on its way to recovery from the drop in prices earlier this month. The longer-term trend was bearish, but over the past couple of days, the buyers have been in a position of strength. The $510 was a key level on the charts, with the $500 area offering strong support over the past six weeks. It was likely that Binance Coin would test this level soon, but it was not yet clear whether the price had the impetus to climb past it.
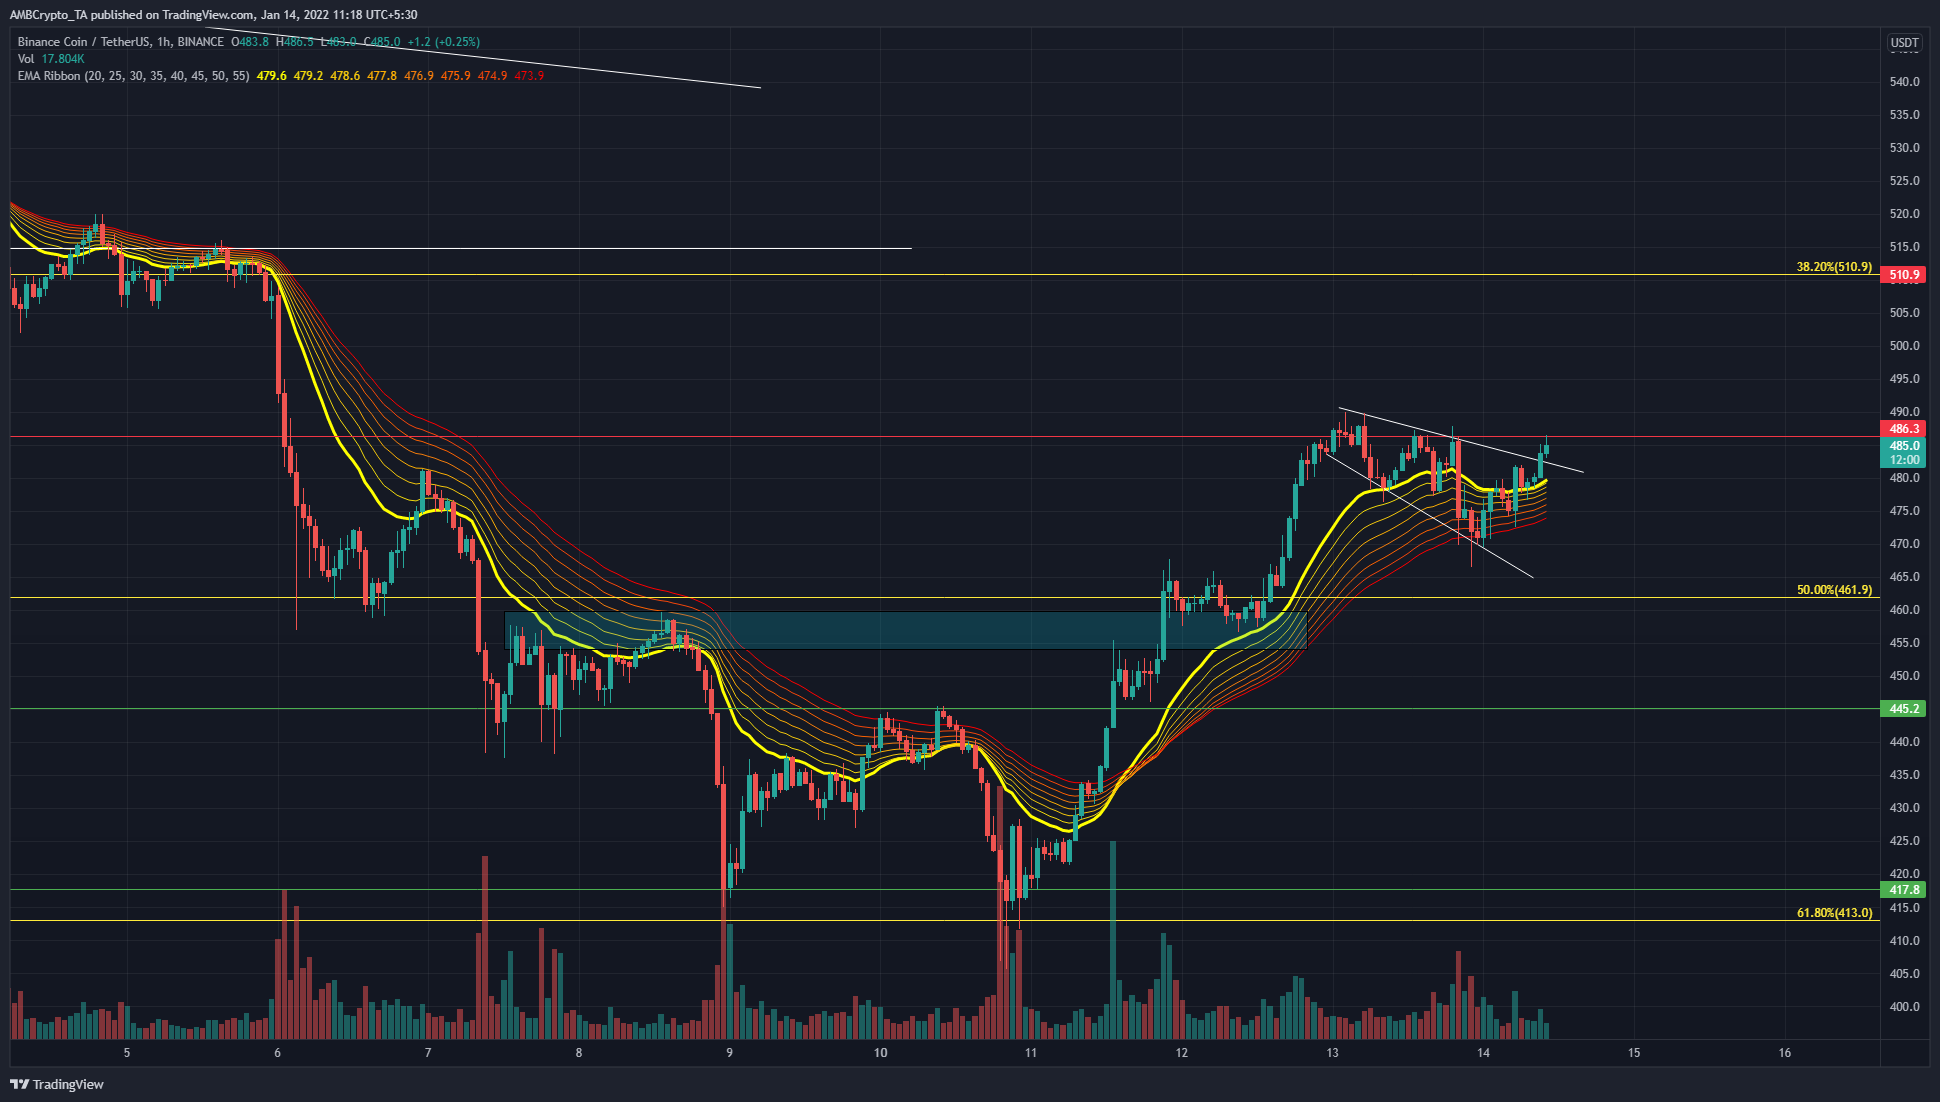
The $413 and $417 levels were horizontal support levels, with $413 being a 61.8% Fibonacci retracement level for BNB’s move from $254.5 to $669.3. The 61.8% to 78.6% retracement areas are places on the chart where pullbacks tend to reverse.
The price was able to climb from $415 to $455 within a day and flipped the $455 area (cyan box) from a zone of supply to one of demand. This move also broke the short-term market structure as the price registered a higher high.
Subsequently, BNB climbed further to test $486 as resistance. It was unable to break the level on one go and formed a descending broadening wedge (white). This pattern signaled a continuation upward for BNB, and the price did break out to the upside of the pattern.
The $510 level was the 38.2% retracement level, and the $505-$515 area has been significant support since mid-November.
Rationale
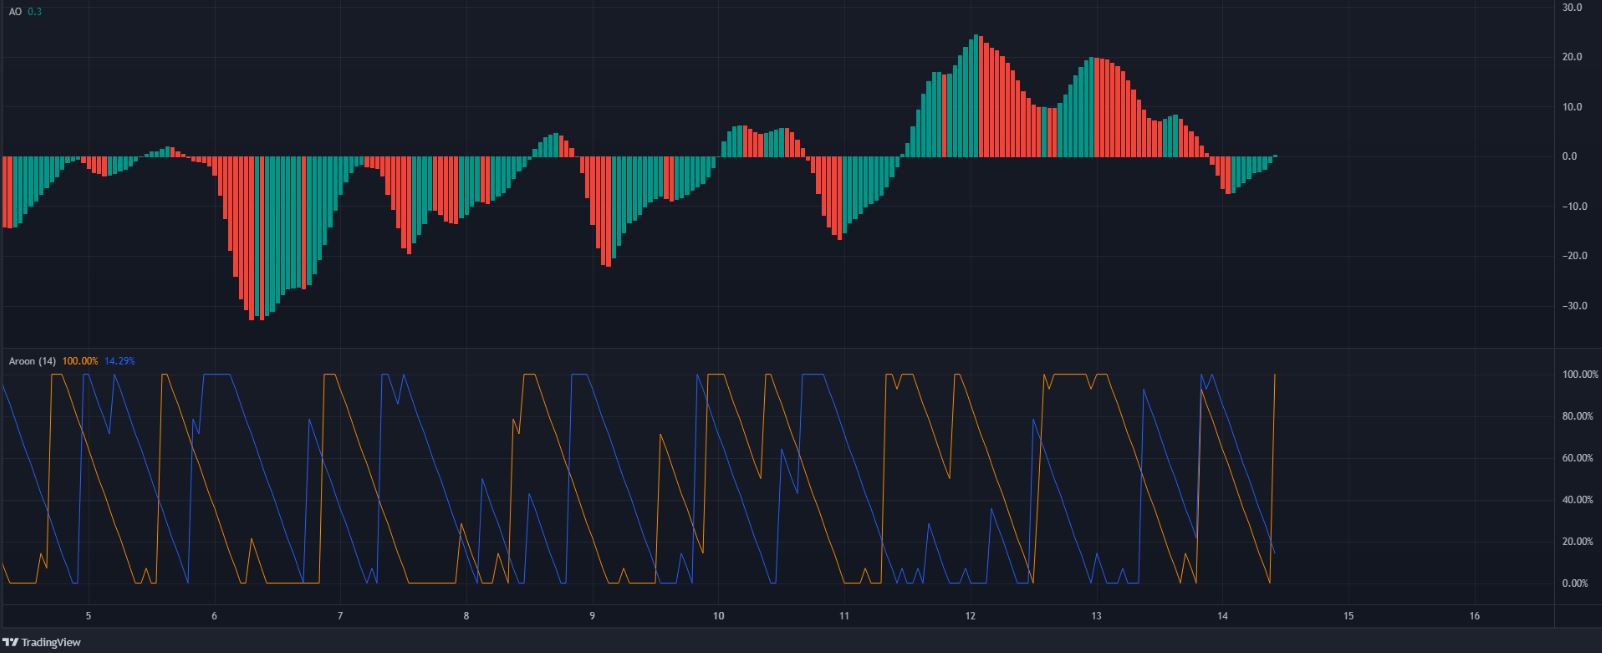
The EMA ribbon was below the price, which showed bullish momentum. The Aroon indicator showed that a bullish trend was beginning to form, following the breakout upward.
The Awesome Oscillator formed lower highs in the past two days, even as the price tested the $486 resistance twice (equal highs on the price). This bearish divergence saw BNB form a higher low at $470 before demand stepped in once more. The AO registered green bars in recent hours and was on the verge of closing a session above the zero line, which would show bullish momentum was on the rise once again.
Conclusion
At the time of writing, momentum and demand were driving the price higher. It appeared likely that this move would reach $510, consolidate below resistance, and breakout to the upside again. However, a move past $510 would need Bitcoin to either range or climb higher on the price charts.