
Binance Coin witnessed a major price rally and formed a new ATH at $639. IOTA maintained above $1.995 support, while Hedera Hashgraph was expected to break out from its descending channel at $0.33 support.
Binance Coin [BNB]
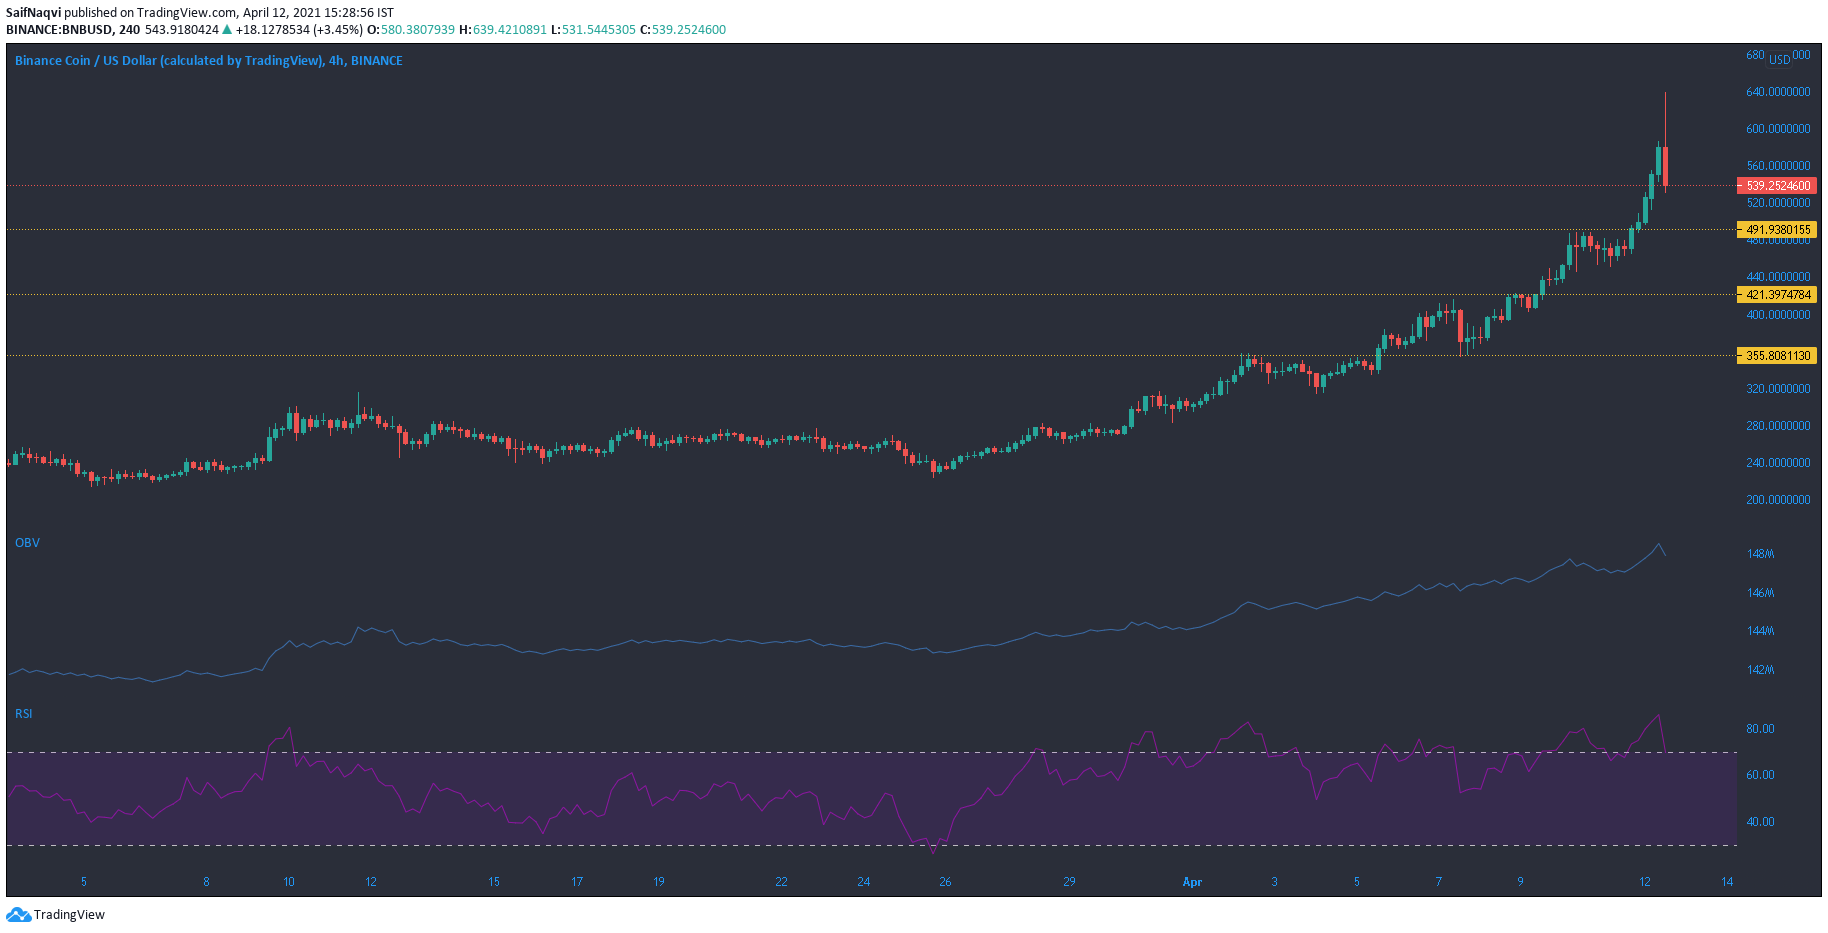
Source: BNB/USD, TradingView
At the time of writing, Binance Coin was amidst a massive price surge and jumped by 21% in the last 24 hours alone. Levels presented in a previous analysis were also surpassed as the price formed a new ATH at $639, and the current market conditions may even allow for more gains in the coming sessions. The OBV witnessed a spike as buying volume heavily out favored selling volume but dipped slightly at press time.
Even though the RSI suggested that BNB needed to stabilize, its current bull run would likely see higher levels before a correction takes place. Meanwhile, the upcoming BNB token burning event may have led to the recent price rally. Binance CEO Changpeng Zhao’s tweet gave a possible explanation for the bullish sentiment in the market.
IOTA
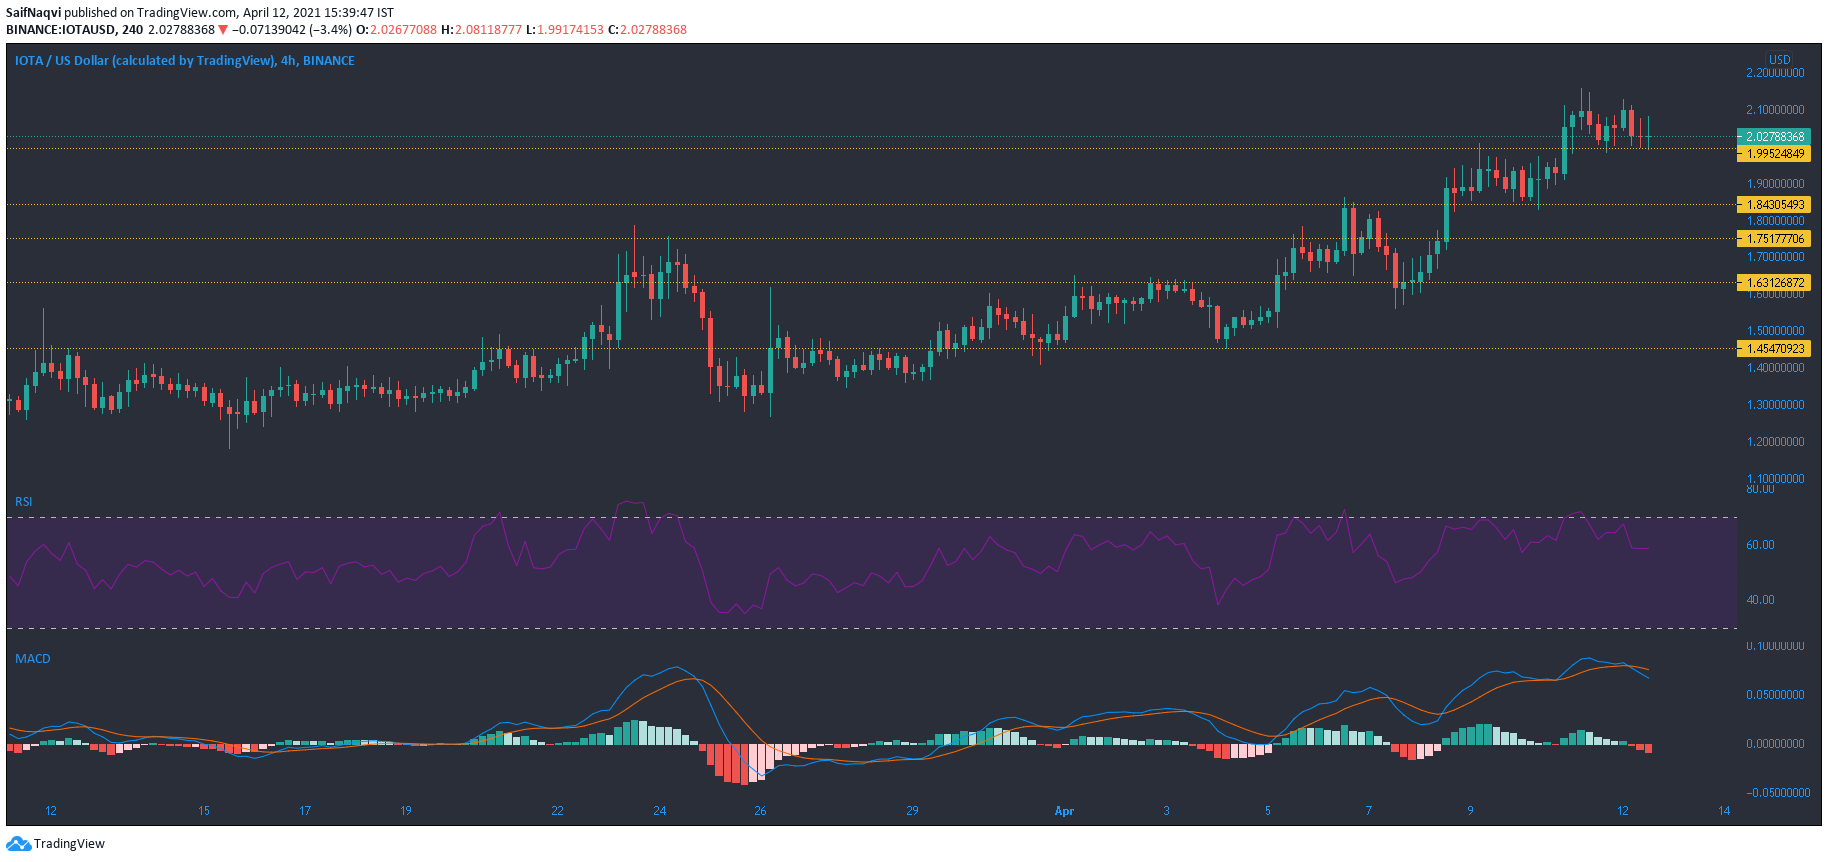
Source: IOTA/USD, TradingView
While a bearish outcome was predicted in a previous analysis, IOTA bulls held on to $1.995 support over the last few sessions. The RSI flattened at 60 and highlighted bullish strength in the market.
On the downside, trading volumes trended lower since the last two days as IOTA saw some rangebound movement. The MACD, while still above the half-line, saw a bearish crossover. Yet, higher highs on the MACD confirmed IOTA’s recent bull market and a breakdown might not be so straightforward. If the press-time support is breached, the next line of defense at $1.84 could cushion additional losses.
Hedera Hashgraph [HBAR]
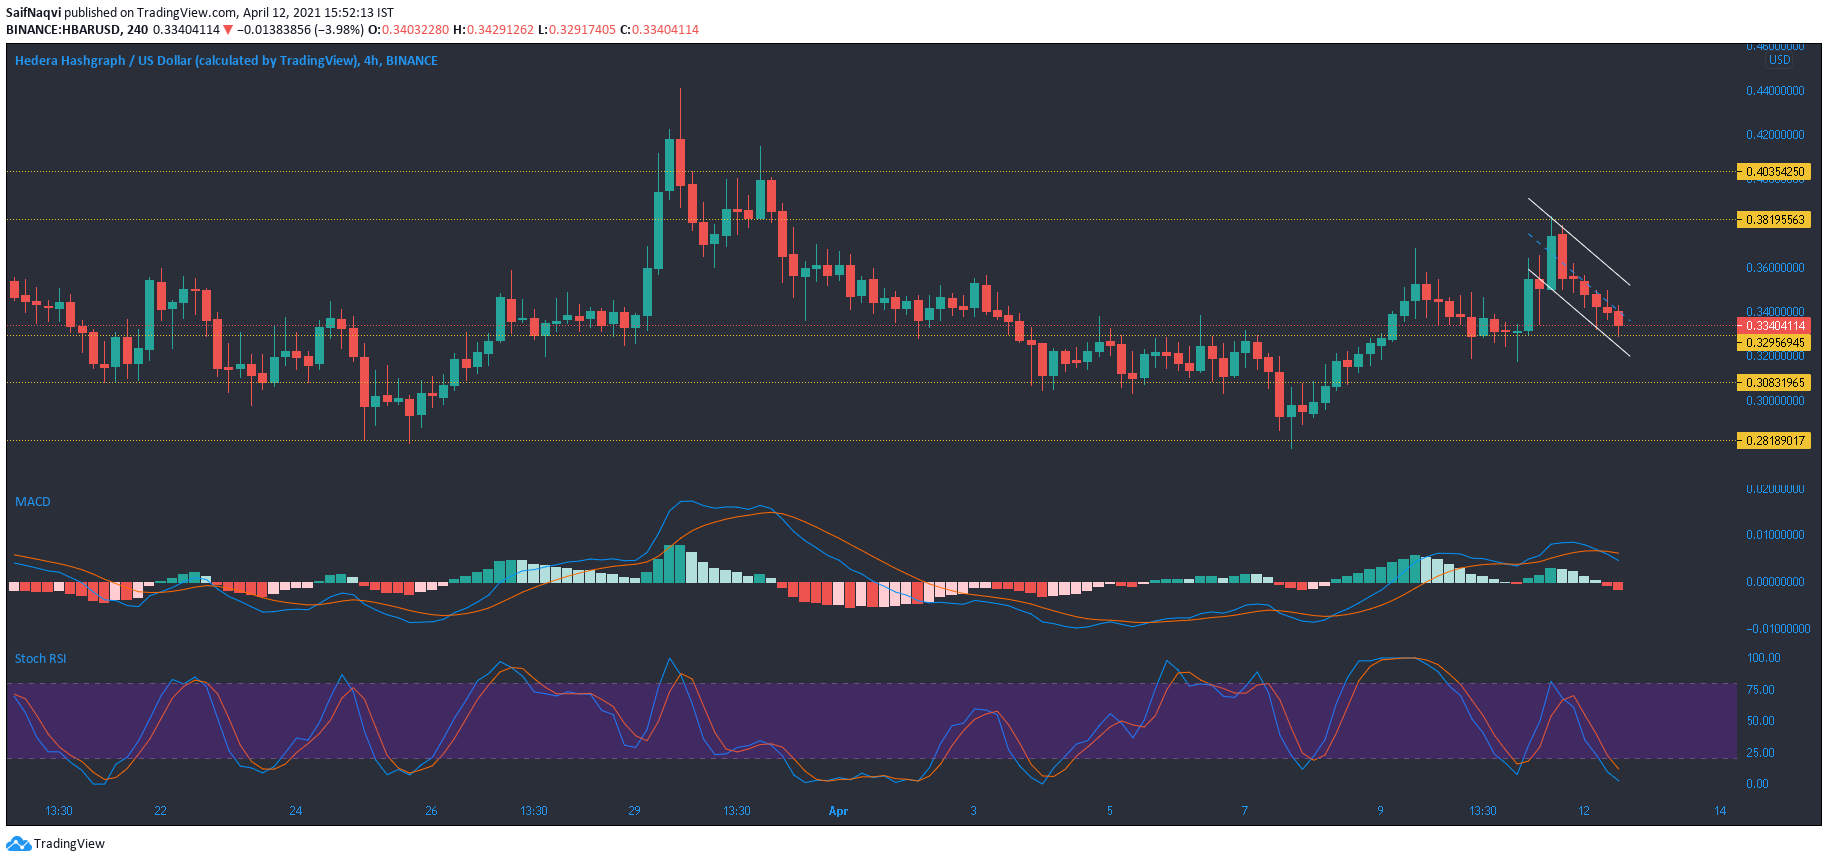
Source: HBAR/USD, TradingView
Another descending channel was spotted on Hedera Hashgraph’s 4-hour chart after the price failed to overturn $0.381 to a line of support. Since then, HBAR moved closer towards another defensive line at $0.33 – a region that has mostly seen buying over the last month. Going by the same logic, HBAR was expected to break north of its descending channel after bouncing back from $0.33.
If the price even breaks above $0.381, then an extended bullish outcome was possible towards $0.403. The Stochastic RSI entered the oversold region and a reversal from this area could initiate a breakout. Even though the MACD showed a bearish crossover, the same was still above the half-line.