Bitcoin Cash, EOS, Enjin Coin Price Analysis: 12 April

Bitcoin Cash needed to defend $668.5 support to avoid a breakdown from its 20-SMA. EOS held above the $6.45 support, while Enjin Coin could slip all the way towards its 200-SMA before attempting a bullish comeback.
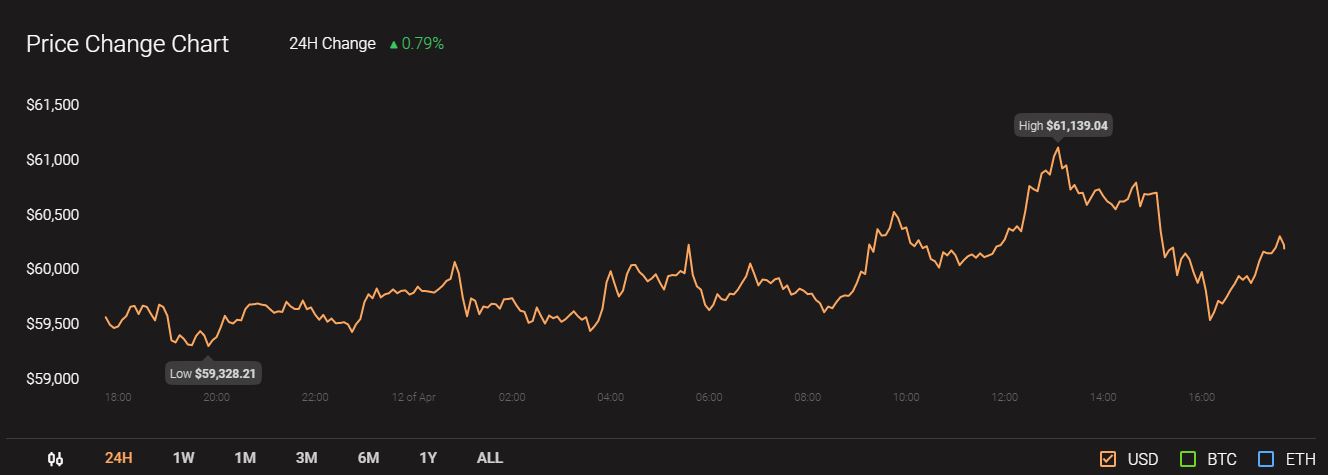
Meanwhile, Bitcoin was trading at $60,217 with a market capitalization of over 1.1 trillion.
Bitcoin Cash [BCH]
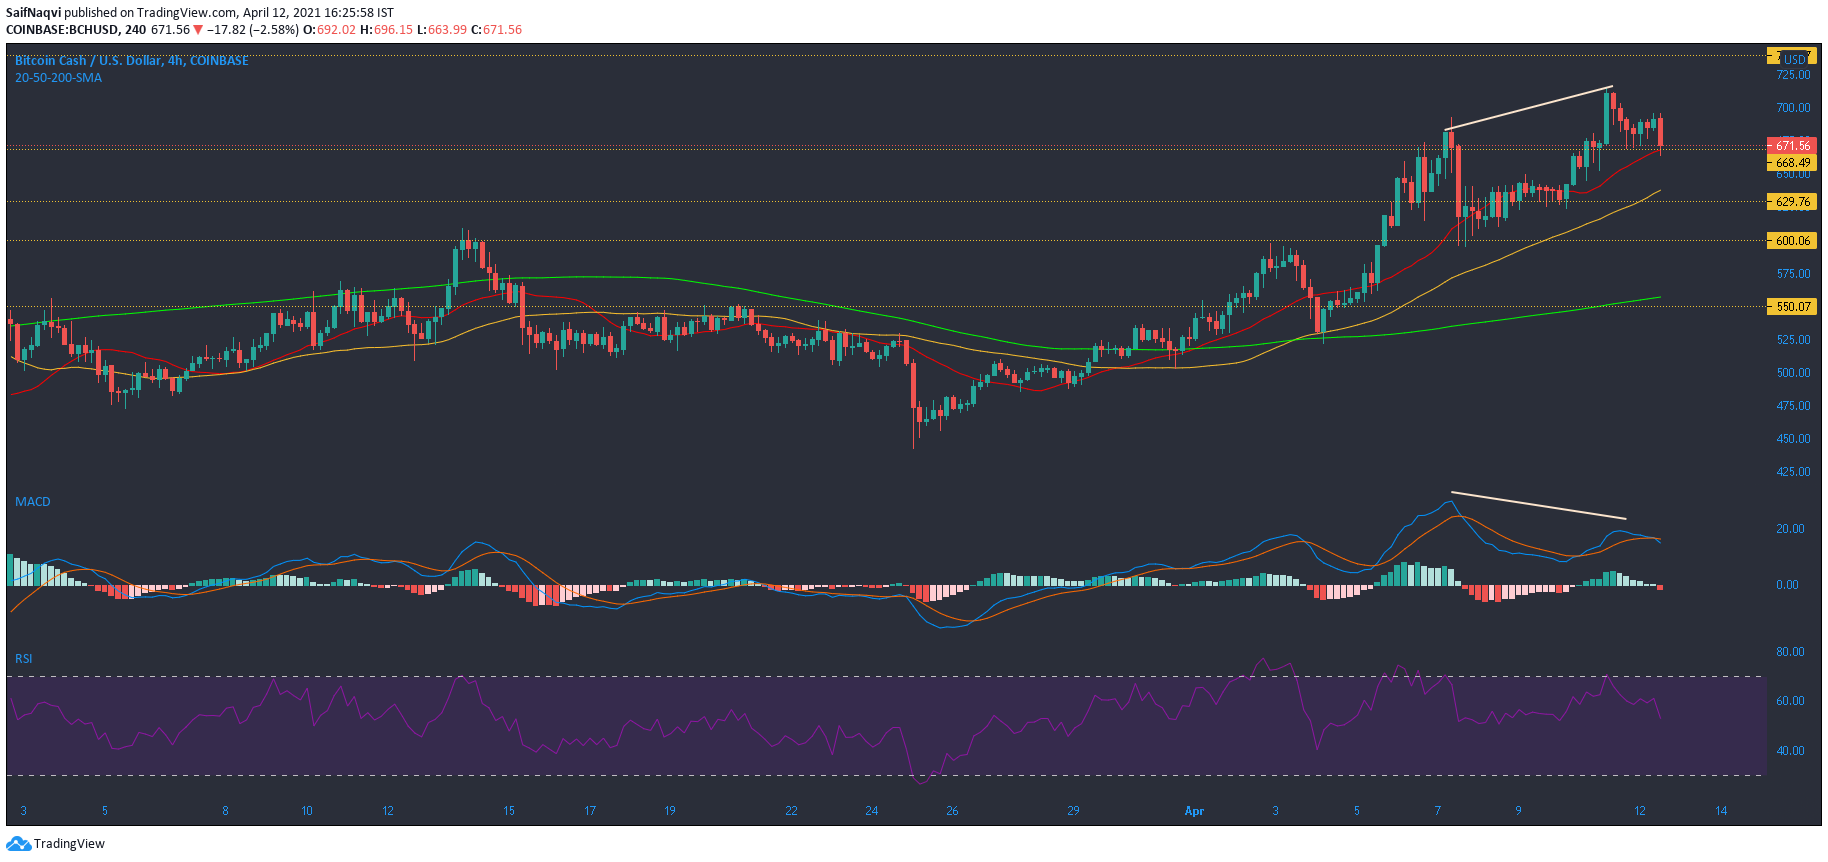
Bitcoin Cash needed to hold on to $668.5 support over the coming sessions to avoid a breakdown from its 20-SMA (red). Additional support areas lay at $629.6 and at $600 and these levels would be in focus in case of a southbound move.
A bearish divergence on the MACD lent weight to a breakdown prediction. The Signal line even crossed above the MACD line as bears sought to control the market. The RSI pointed south from 52 and a dip below 40 could even see BCH lose out on the $600 level. A stronger region of support lay at $550 as it coincided with the 200-SMA (green), but a dip below this could be damaging for BCH’s mid-long term trajectory.
EOS
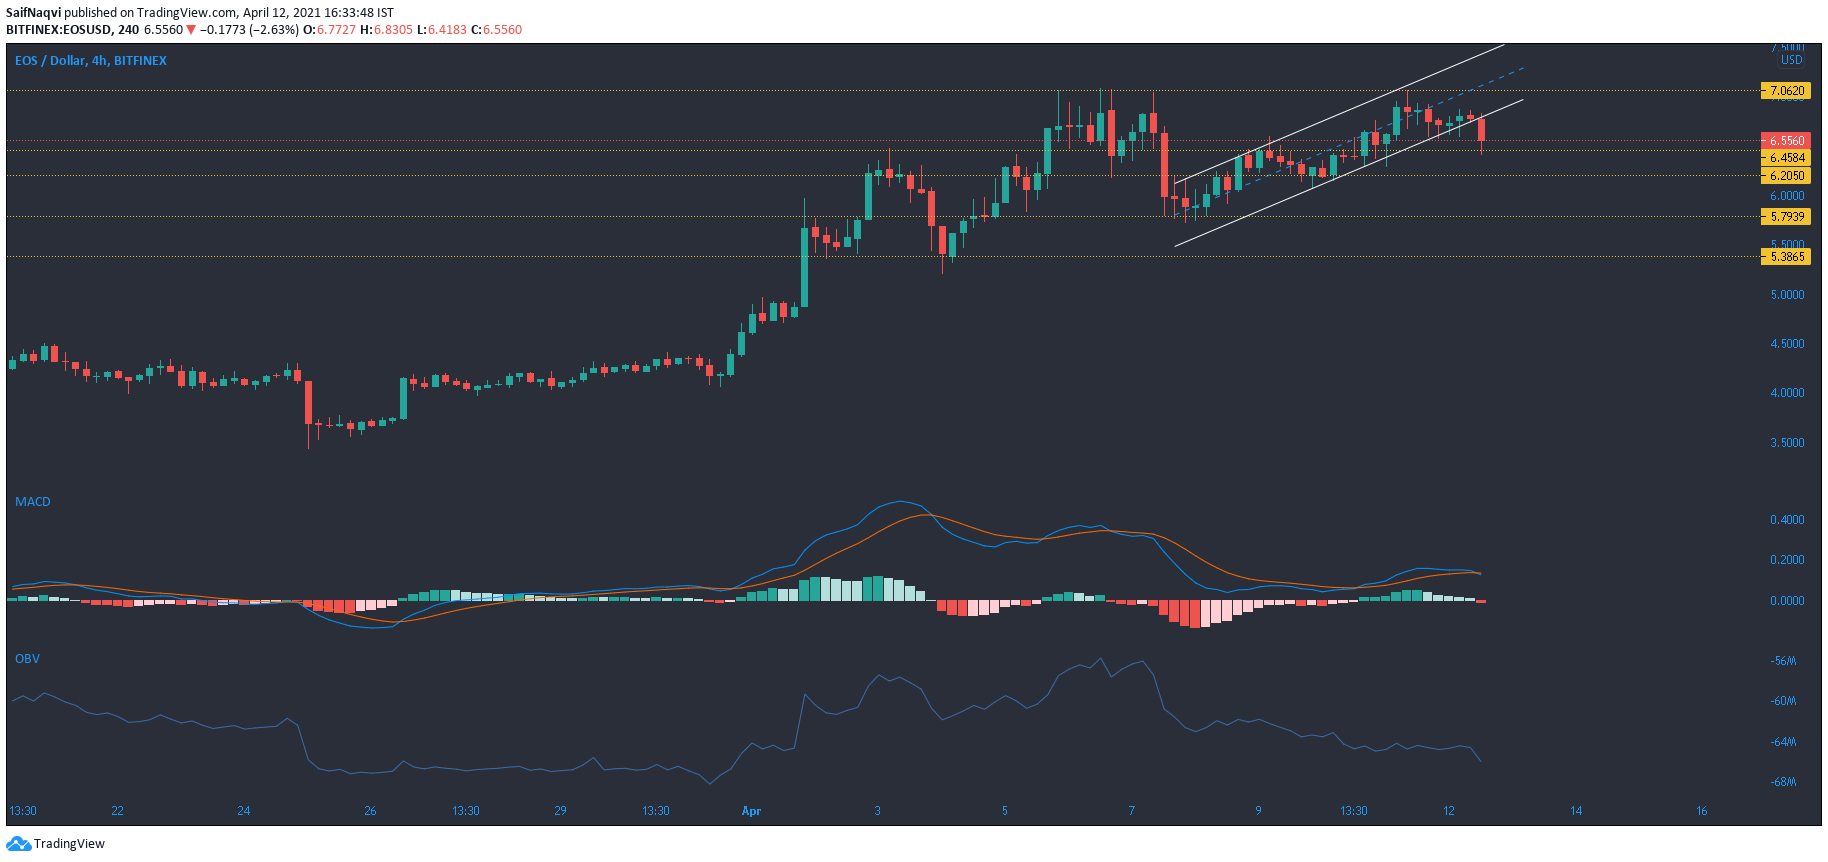
EOS broke south of its ascending channel at the time of writing and hovered just above a support mark at $6.45. If this level is maintained, then EOS bulls could look to reattempt a break above $7.06-resistance. On the other hand, the OBV formed lower highs and highlighted strong selling pressure in the market.
A southbound move was likely according to this and additional support layers stood at $6.2 and $5.7. A bearish crossover in the MACD heightened the possibility of a breakdown as well. If the same also moves below the equilibrium line, the price could remain subdued over the short-mid term.
Enjin Coin [ENJ]
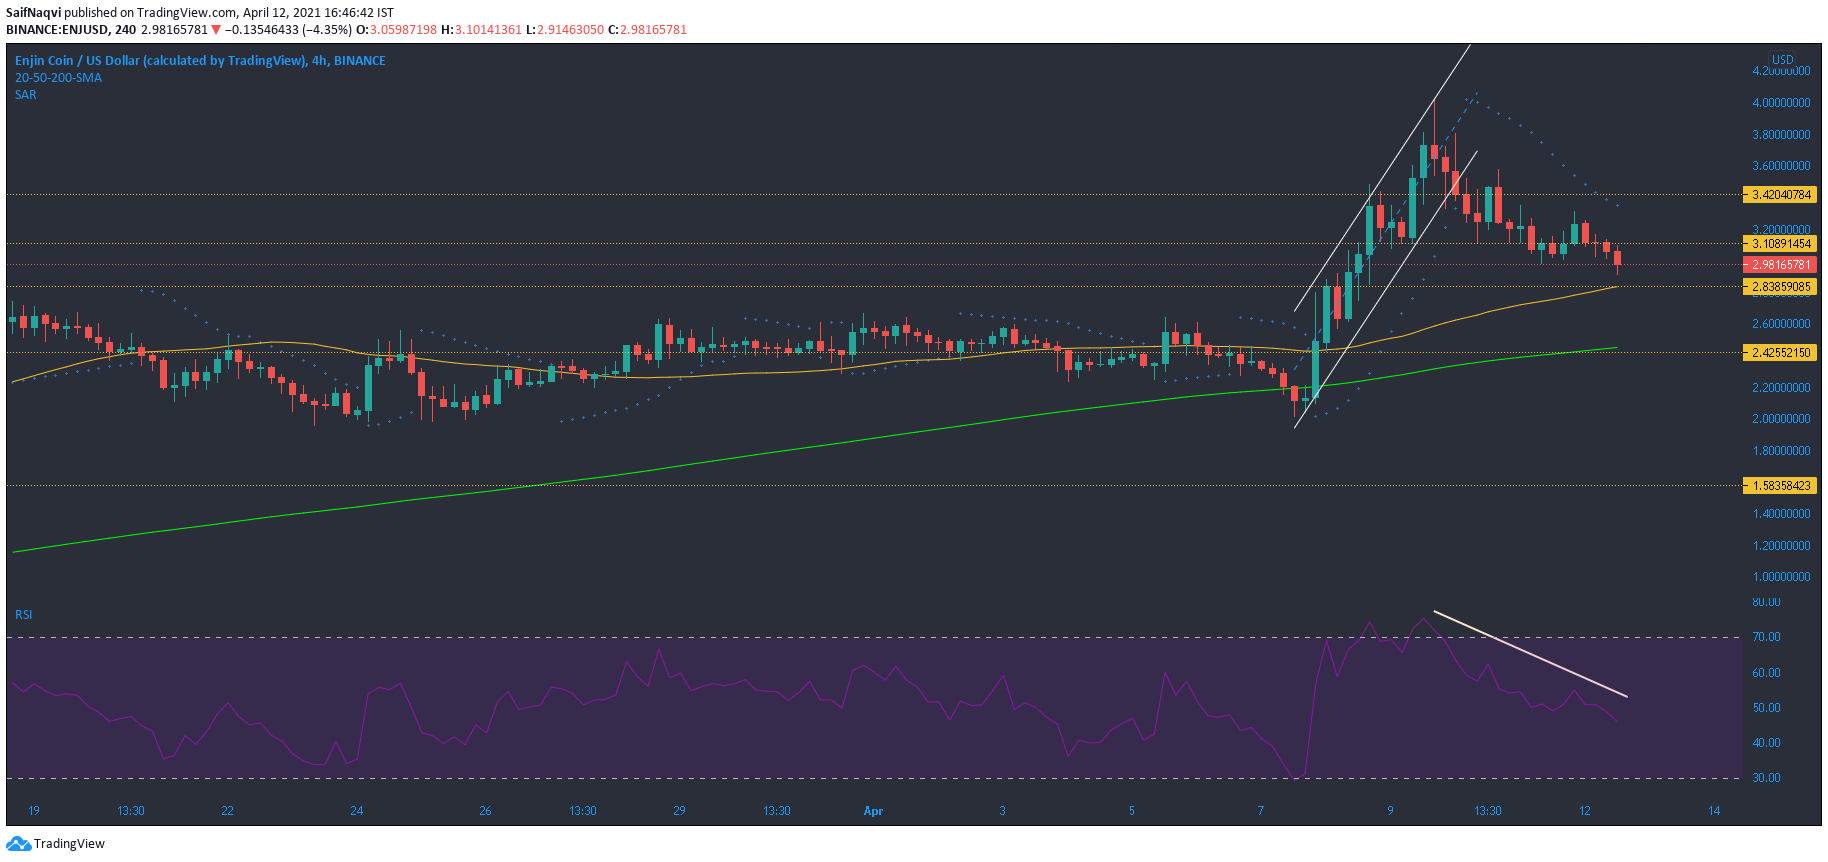
A correctional phase in Enjin Coin continued to drag prices over the last 24 hours as the price moved towards $2.94 support. However, this was well within expectations but the bulls must be wary of stopping losses at $2.83. A breakdown below this and the 50-SMA (blue) would likely drag ENJ towards the 200-SMA (green). The price has not moved below its long-term moving average even once since early January, and the bulls would be looking to maintain this over the coming sessions.
The Parabolic SAR’s dotted markers moved below the candlesticks and showed a downtrend since ENJ retraced from the $4-mark. Lower highs on the RSI also confirmed a bearish trend in the market.


