Binance Coin, MATIC, Tron Price Analysis: 10 January

As Bitcoin and Ethereum lost their long-term supports, Binance Coin and Tron poked their multi-month lows on 8 January. Now, the 20-EMA stood as powerful resistance for them. Moreover, MATIC lost the critical 61.8% Fibonacci support level.
Binance Coin (BNB)
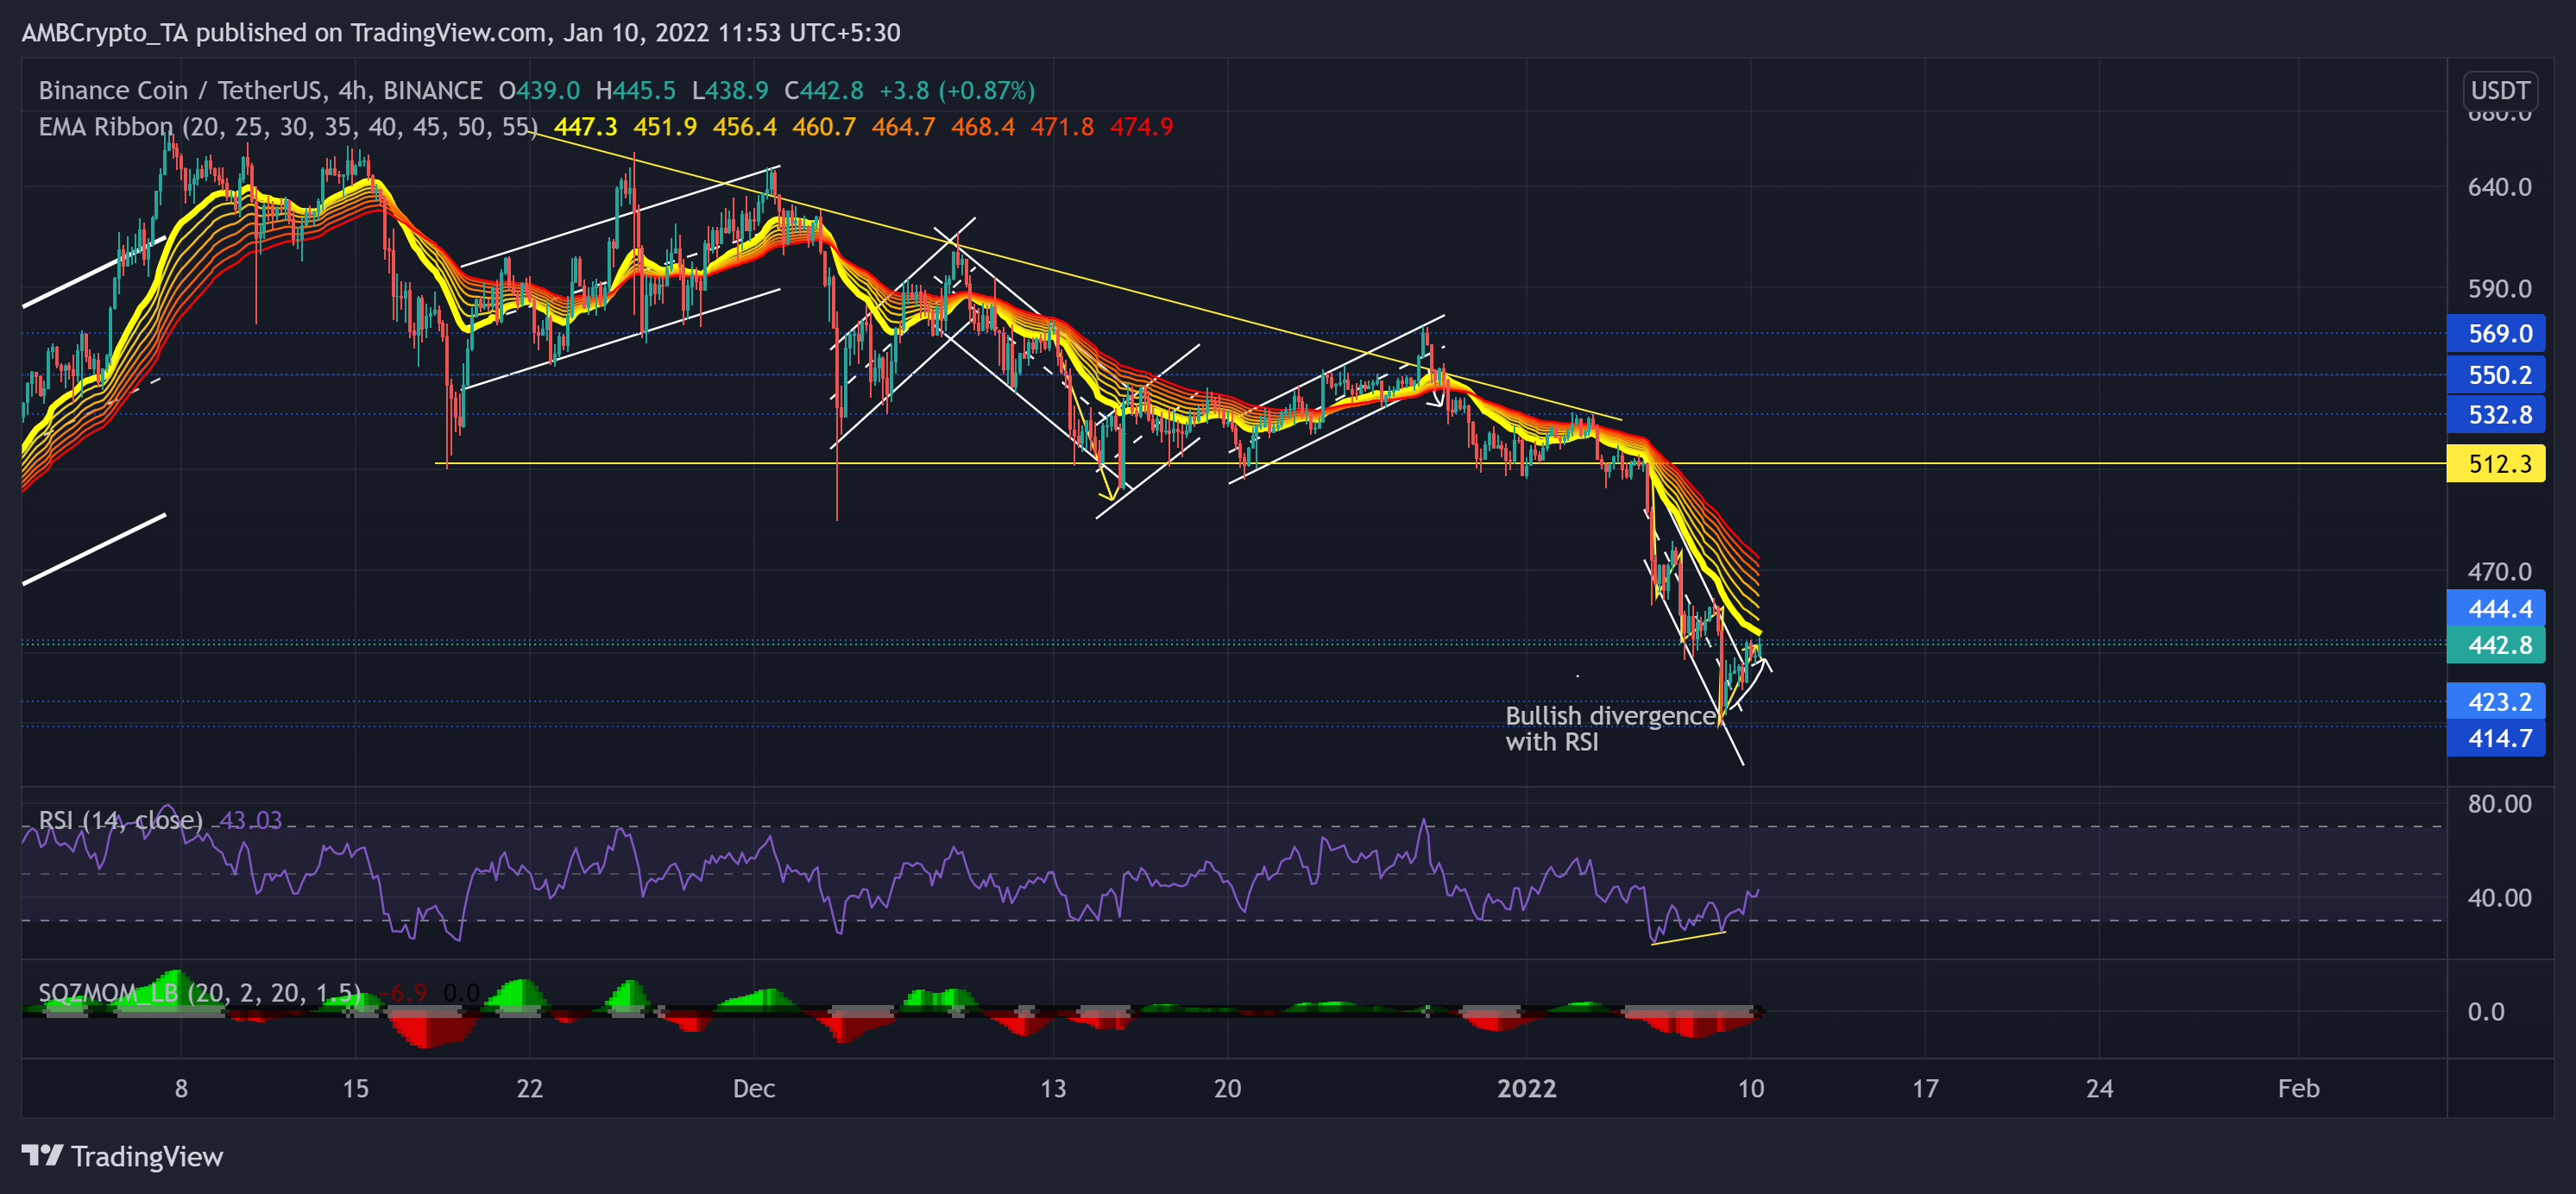
Since 26 November, BNB tested the $512-level support multiple times while marking lower peaks. Thus, it saw a descending triangle (yellow) on its 4-hour chart, visibly depicting the increased selling pressure.
The aforestated level offered the highest trading volumes in the past four months. But the 5 January sell-off braced BNB’s already existent bearish vigor as the alt saw a patterned breakdown.
With an over 18% loss of its value (from 5 January), the altcoin poked its three-month low on 8 January. As a result, the gap between the EMA ribbons increased while the 20 EMA stood as an immediate hurdle for BNB bulls.
At press time, the alt traded at $442.8. The RSI saw a surge after a bullish divergence with the price action. Consequently, BNB broke out of the down-channel (white). Now, the Squeeze Momentum Indicator flashed black dots, hinting at a low volatility phase.
Polygon (MATIC)

The alt registered a nearly 70% ROI (from 14 December low) and rallied toward its ATH on 27 December.
Since then, it tested the 38.2% Fibonacci support multiple times while the bears kept increasing the selling pressure. After a nearly 23% retracement (from 5 January), MATIC poked its three-week low on 8 January. As a result, it lost the vital 61.8% while reclaiming the 78.6% Fibonacci support.
At press time, MATIC traded 27% below its ATH at $2.138. Since 28 December, the RSI failed to mark a convincingly close above the half-line. Although it saw a bullish divergence with the price, it struggled to cross the midline.
Further, the Awesome Oscillator was below the equilibrium but depicted increasing buying pressure by marking higher troughs.
Tron (TRX)

Tron has been on a persistent downtrend after it poked its six-month high on 15 November. Since then, the alt marked a bearish flag and three down-channels on its 4-hour chart. Consequently, it lost nearly 50.27% of its value to date.
While the price oscillated sideways in the previous demand zone (now supply zone, yellow rectangle), the buyers failed to step in as TRX withdrew by nearly 17% (from 5 January). As a result, the altcoin poked its five-month low on 8 January. The gap between the EMA ribbons increased while the 20 EMA stood as a testing point for the bulls now.
At press time, TRX traded at $0.0666. While the $0.064-support stood strong, the RSI rose from the oversold territory after testing it thrice in four days. Although the MACD lines were below the equilibrium, they depicted increasing buying power.


