Binance Coin Price Analysis: 07 February

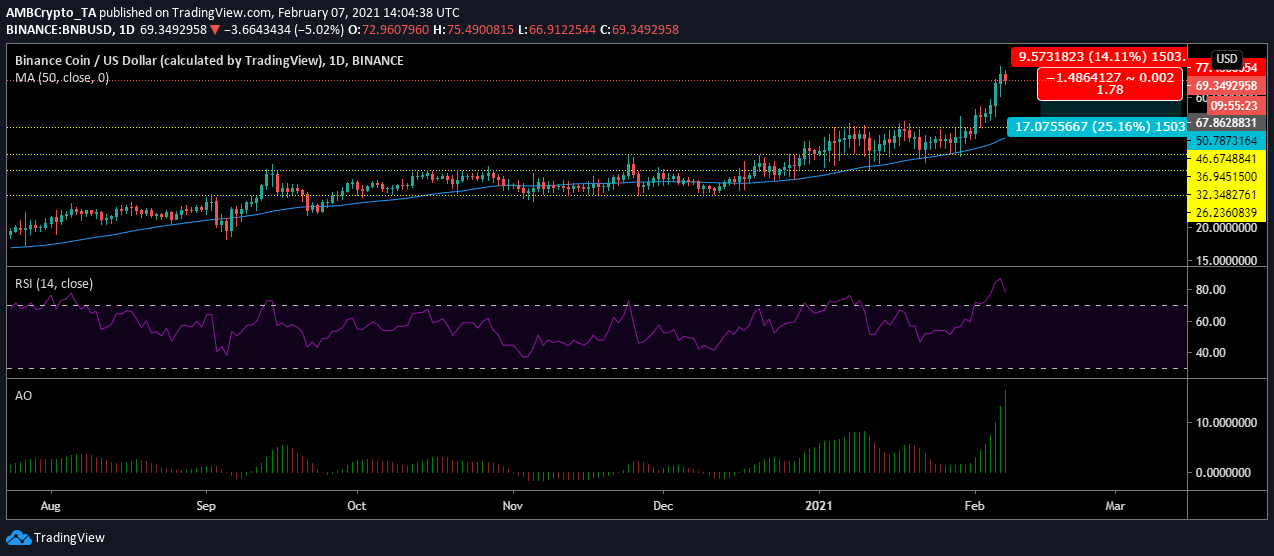
Amid an extremely bullish crypto market, Binance coin [BNB] has hit a new all-time high at $77.9 according to the price charts. The cryptocurrency has been seeing its value spike since the beginning of the year.
BNB was in the uncharted territory like many other altcoins, however, rising selling pressure could push it to the support at $46 if the trend were to see a reversal.
Binance Coin daily chart

Source: BNBUSD on TradingView
After surging past the resistance at $46, BNB’s price was noting a peak currently. Before the peak, it was bouncing between $46.67 and $36.94 for quite some time and maintained the bullishness of the market. However, as it hit the peak, there has been a massive gap between the price bars and the candlesticks.
There could be a sudden fall witnessed in the market as a result of a mark of correction, but since there was no support level observed between $46 and $77, the drop could be massive.
Reasoning
As the price moved sharply, the market was saturated with buyers. The Relative Strength Index marked the wide presence of the buyers in the market as it remained in the overbought zone for the past week. The RSI signal was pointing lower as the selling of BNB increased in the market and may plunge under 70 as the selling increases.
Meanwhile, the market’s high momentum was reflected by the Awesome Oscillator. The growing green bars suggested the increasing momentum in the market and the above chart indicated that such high momentum was not witnessed in the BNB market previously. This could be a signal for an approaching trend reversal.
Crucial levels
Entry-level: $67.86
Take profit: $50.78
Stop-loss: $77.43
Risk and Reward ratio: 1.78
Conclusion
The Binance Coin [BNB] price had been peaking with bullishness, however, this trend might be at the brink of a reversal. As the digital asset market remained saturated with buyers, a sell-off can be expected. The selling pressure has begun to emerge and if it grows it will push the asset’s value towards to the support at $46.


